3 Promising Penny Stocks With Market Caps At Least US$300M
As global markets navigate a mix of economic signals, including steady interest rates from the Fed and rate cuts by the ECB, investors are closely watching for opportunities amid volatility. Penny stocks, though often overlooked due to their historical connotations, continue to offer intriguing prospects for growth within smaller or newer companies. When these stocks exhibit strong financial health and solid fundamentals, they can provide upside potential while mitigating some of the associated risks.
Top 10 Penny Stocks
| Name | Share Price | Market Cap | Financial Health Rating |
| DXN Holdings Bhd (KLSE:DXN) | MYR0.53 | MYR2.64B | ★★★★★★ |
| Bosideng International Holdings (SEHK:3998) | HK$3.75 | HK$43.08B | ★★★★★★ |
| Hil Industries Berhad (KLSE:HIL) | MYR0.88 | MYR285.47M | ★★★★★★ |
| MGB Berhad (KLSE:MGB) | MYR0.705 | MYR417.12M | ★★★★★★ |
| Datasonic Group Berhad (KLSE:DSONIC) | MYR0.395 | MYR1.1B | ★★★★★★ |
| Lever Style (SEHK:1346) | HK$1.11 | HK$704.62M | ★★★★★★ |
| Embark Early Education (ASX:EVO) | A$0.78 | A$143.12M | ★★★★☆☆ |
| Tristel (AIM:TSTL) | £3.75 | £178.85M | ★★★★★★ |
| China Lilang (SEHK:1234) | HK$4.00 | HK$4.79B | ★★★★★☆ |
| Secure Trust Bank (LSE:STB) | £4.40 | £83.91M | ★★★★☆☆ |
Click here to see the full list of 5,711 stocks from our Penny Stocks screener.
Below we spotlight a couple of our favorites from our exclusive screener.
ForFarmers (ENXTAM:FFARM)
Simply Wall St Financial Health Rating: ★★★★☆☆
Overview: ForFarmers N.V. is a company that offers feed solutions for both conventional and organic livestock farming across several European countries and internationally, with a market cap of €301.40 million.
Operations: The company generates €2.72 billion in revenue from its food processing segment.
Market Cap: €301.4M
ForFarmers N.V., with a market cap of €301.40 million and revenues of €2.72 billion, has shown financial resilience despite challenges. The company's short-term assets exceed both its short- and long-term liabilities, indicating strong liquidity. However, a significant one-off loss impacted recent earnings, though it has become profitable this year with earnings forecasted to grow annually by 21.31%. While trading significantly below estimated fair value suggests potential undervaluation, the company faces management turnover with an inexperienced team averaging 1.7 years in tenure and upcoming changes in its Supervisory Board leadership as part of Strategy 2025 implementation efforts.
- Navigate through the intricacies of ForFarmers with our comprehensive balance sheet health report here.
- Evaluate ForFarmers' prospects by accessing our earnings growth report.

Pan Asia Environmental Protection Group (SEHK:556)
Simply Wall St Financial Health Rating: ★★★★★★
Overview: Pan Asia Environmental Protection Group Limited, with a market cap of HK$480.15 million, operates in the People’s Republic of China selling environmental protection products and equipment through its subsidiaries.
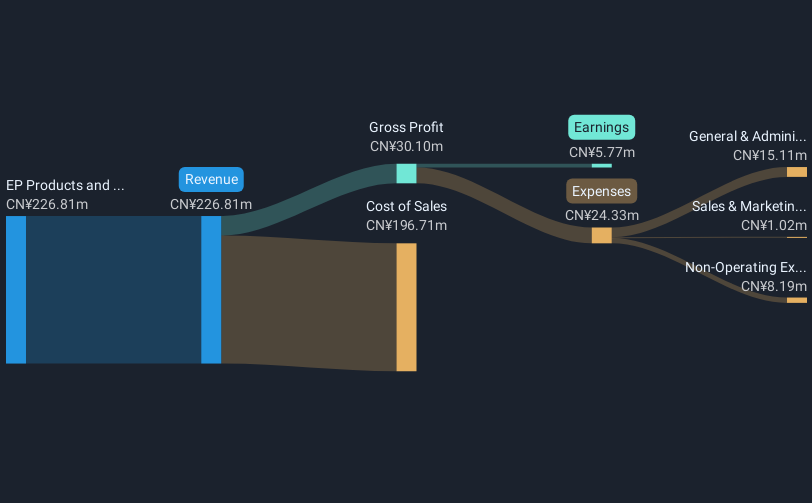
Operations: The company generates revenue of CN¥226.81 million from its EP Products and Equipment segment.
Market Cap: HK$480.15M
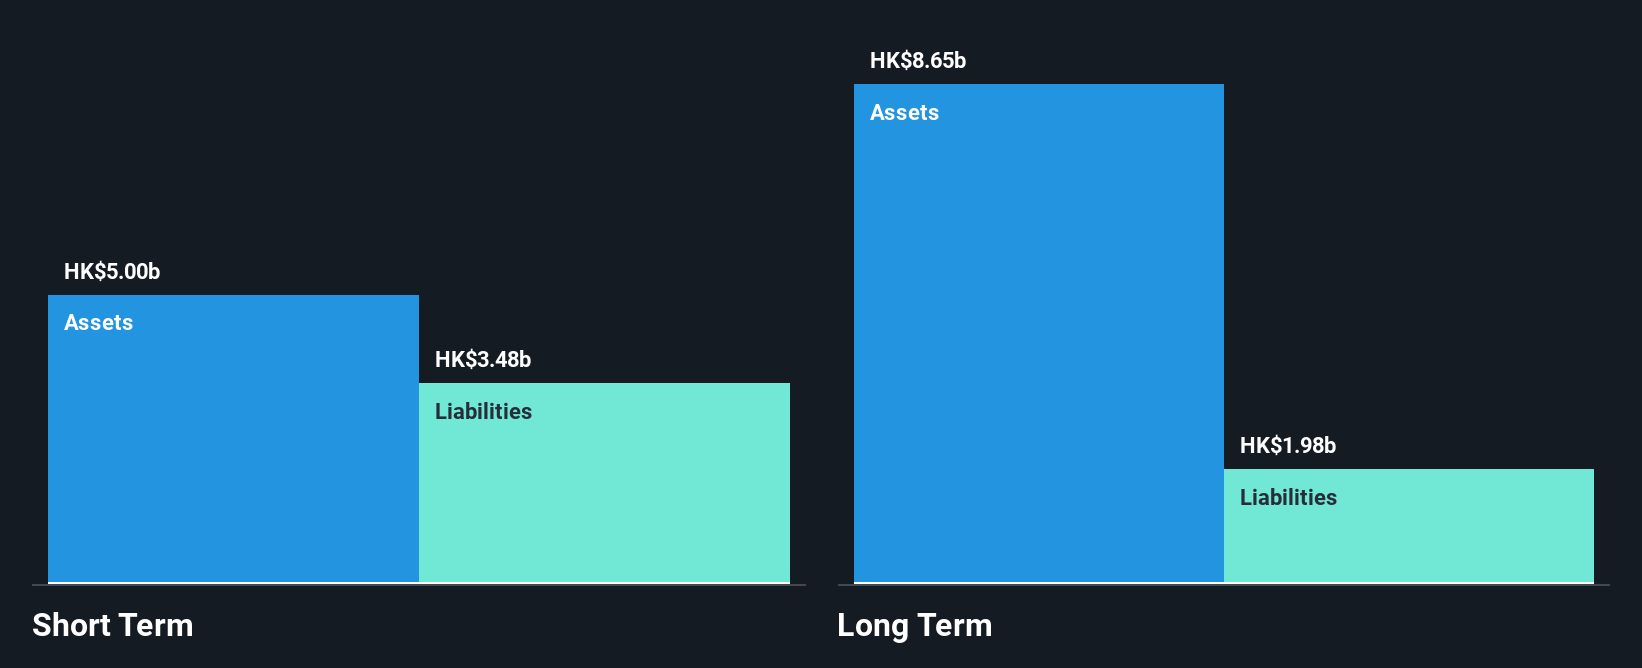
Pan Asia Environmental Protection Group, with a market cap of HK$480.15 million, has demonstrated significant earnings growth over the past five years, becoming profitable and increasing earnings by 65.8% annually. The company boasts strong financial health with short-term assets of CN¥1.3 billion surpassing both its short- and long-term liabilities, while its debt is well-covered by operating cash flow and interest payments are easily managed by EBIT. Despite this financial strength and trading at a substantial discount to estimated fair value, the management team lacks experience with an average tenure of just 0.9 years, which may pose challenges moving forward.
- Take a closer look at Pan Asia Environmental Protection Group's potential here in our financial health report.
- Examine Pan Asia Environmental Protection Group's past performance report to understand how it has performed in prior years.
Viva Goods (SEHK:933)
Simply Wall St Financial Health Rating: ★★★★★☆
Overview: Viva Goods Company Limited is an investment holding company that supplies apparel and footwear across various regions including the United Kingdom, Republic of Ireland, America, China, Asia, Europe, the Middle East, and Africa with a market capitalization of approximately HK$5.74 billion.
Operations: The company generates revenue from two main segments: Sports Experience, contributing HK$530.03 million, and Multi-Brand Apparel and Footwear, which accounts for HK$10.35 billion.
Market Cap: HK$5.74B
Viva Goods Company Limited, with a market cap of HK$5.74 billion, is currently unprofitable with declining earnings of 11.5% annually over the past five years. Despite this, the company trades at 71.5% below its estimated fair value and has reduced its debt-to-equity ratio significantly from 27.5% to 10.3%. The company's short-term assets of HK$5.9 billion comfortably cover both short- and long-term liabilities, and it possesses more cash than total debt, indicating strong liquidity management. Recent board changes include the appointment of Mr. Qian Cheng as a non-executive director, bringing extensive investment industry experience to the team.
- Click to explore a detailed breakdown of our findings in Viva Goods' financial health report.
- Understand Viva Goods' track record by examining our performance history report.
Seize The Opportunity
- Gain an insight into the universe of 5,711 Penny Stocks by clicking here.
- Already own these companies? Bring clarity to your investment decisions by linking up your portfolio with Simply Wall St, where you can monitor all the vital signs of your stocks effortlessly.
- Streamline your investment strategy with Simply Wall St's app for free and benefit from extensive research on stocks across all corners of the world.
Want To Explore Some Alternatives?
- Explore high-performing small cap companies that haven't yet garnered significant analyst attention.
- Jump on the AI train with fast growing tech companies forging a new era of innovation.
- Find companies with promising cash flow potential yet trading below their fair value.
This article by Simply Wall St is general in nature. We provide commentary based on historical data and analyst forecasts only using an unbiased methodology and our articles are not intended to be financial advice. It does not constitute a recommendation to buy or sell any stock, and does not take account of your objectives, or your financial situation. We aim to bring you long-term focused analysis driven by fundamental data. Note that our analysis may not factor in the latest price-sensitive company announcements or qualitative material. Simply Wall St has no position in any stocks mentioned.
New: Manage All Your Stock Portfolios in One Place
We've created the ultimate portfolio companion for stock investors, and it's free.
• Connect an unlimited number of Portfolios and see your total in one currency• Be alerted to new Warning Signs or Risks via email or mobile• Track the Fair Value of your stocks
Try a Demo Portfolio for FreeHave feedback on this article? Concerned about the content? Get in touch with us directly. Alternatively, email editorial-team@simplywallst.com
免责声明:投资有风险,本文并非投资建议,以上内容不应被视为任何金融产品的购买或出售要约、建议或邀请,作者或其他用户的任何相关讨论、评论或帖子也不应被视为此类内容。本文仅供一般参考,不考虑您的个人投资目标、财务状况或需求。TTM对信息的准确性和完整性不承担任何责任或保证,投资者应自行研究并在投资前寻求专业建议。
热议股票
- 1
- 2
- 3
- 4
- 5
- 6
- 7
- 8
- 9
- 10