EPOL: Seek Alternatives Elsewhere
dzika_mrowka/iStock via Getty Images
Investment Thesis
iShares MSCI Poland ETF (NYSEARCA:EPOL) owns a portfolio of about 35 Polish equities. The fund has an attractive 12-month dividend yield of about 4.4%. However, its expense ratio of 0.59% is rather high. Other emerging market funds such as SPDR Portfolio Emerging Markets ETF (SPEM) only charges 0.07%. The fund has a high exposure to cyclical sectors but low exposure to growth sectors such as the technology sector. Therefore, its growth outlook appears to be inferior to the S&P 500 index. From a macroeconomic perspective, Poland's economy remains weak despite improving business confidence and manufacturing PMI readings. Although EPOL's valuation appears to be attractive, given its weaker growth profile, we think investors may want to seek funds that focus on other countries instead.
YCharts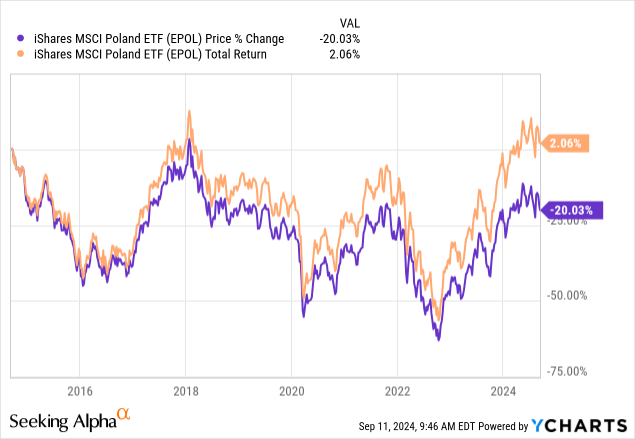
Fund Analysis
Growth profile not attractive
Below is a table that shows the sector allocation of EPOL. As can be seen from the table, financial services, consumer cyclical and basic materials sector together represent 68.2% of the total portfolio. That is over two-thirds of the portfolio. As we know, cyclical sectors tend to perform well when the economy is prosperous and tend to perform poorly when the economy is in a downturn. Therefore, it is important to look at Poland's economy from a macroeconomic perspective. We will do that later in our article.
Morningstar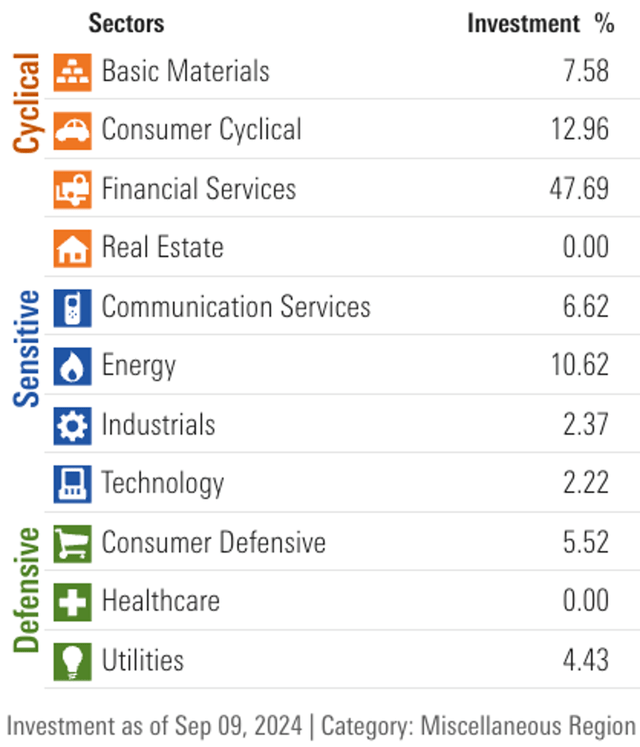
Besides EPOL's high exposure to cyclical sectors, it has a very limited exposure to the technology sector. In fact, as seen from the table above, the technology sector only represents 2.2% of EPOL's total portfolio. For reader's reference, the technology sector represents over 30% of the S&P 500 index. Even MSCI Germany Index has an 18.4% exposure to technology sector. EPOL's low exposure to the technology sector means that the fund will not be able to benefit from many long-term technological growth trends such as artificial intelligence, cloud computing, e-commerce, industrial automation, Internet of Things, etc. Therefore, we think EPOL's growth profile is rather weak.
EPOL has significantly underperformed the S&P 500 index
EPOL's weak growth profile was likely the reason that the fund has significantly trailed the S&P 500 index in performance. As can be seen from the table below, EPOL has only delivered a total return of 36.5% since its inception in 2010. This was significantly behind the S&P 500 index's total return of 580.9%.
YCharts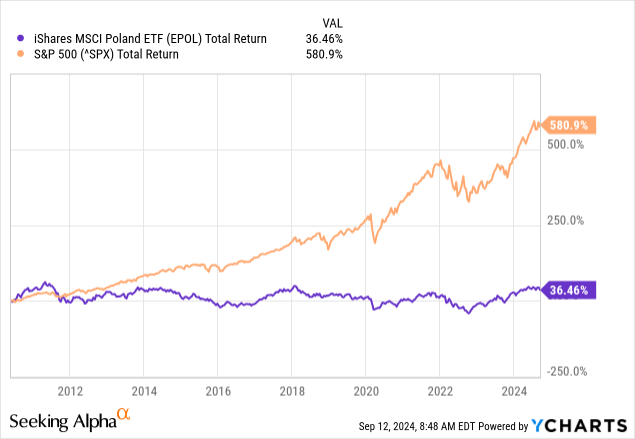
Poland's economy is still not looking bright
Since a significant portion of EPOL's portfolio belongs to cyclical sectors, and that their performance depends on the weakness or strength of the economy, we will now take a look at Poland's macroeconomic environment. We will first look at Poland's business confidence index. As can be seen from the chart below, the latest reading (August 2024) of Poland's business confidence index is at negative 8.20 points. This is a slight improvement from July's reading of negative 9.80 points. For the reader's information, a positive reading suggests increased confidence in near future business performance, and numbers in sub-zero territory indicate pessimism towards future business performance. Although Poland's business confidence index is still below zero, we noticed that it is in a rising trend since the cyclical low reached in October 2022.
Trading Economics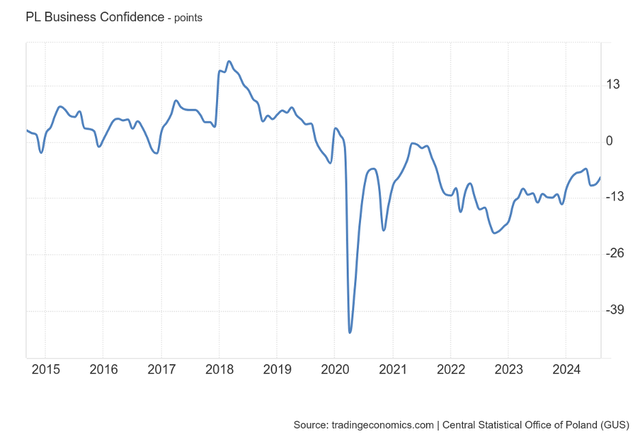
We also observed a similar trend when we look at Poland's manufacturing PMI. As can be seen from the chart below, Poland's manufacturing PMI has been on a rising trend since October 2022. However, it is still below 50. For the reader's information, a reading below 50 generally means manufacturing activities will likely be contracting in the future, whereas a reading above 50 means expansion in manufacturing activities in the future months ahead.
Trading Economics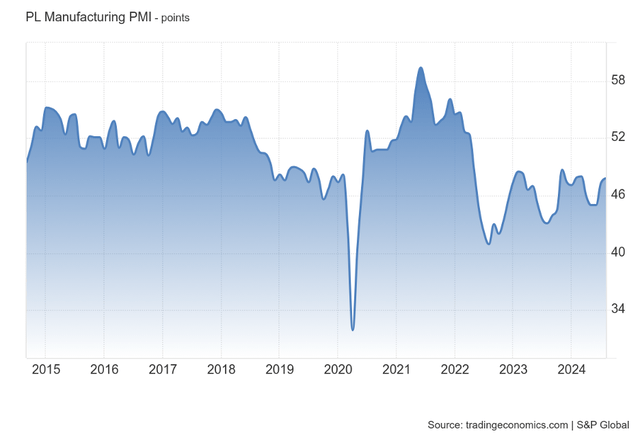
Both the business confidence index and the manufacturing PMI show improvement over the past 2 years, but still not at a level that will lead to material and sustainable economic growth. Therefore, this is not good news for EPOL.
Valuation very attractive
We will check EPOL's valuation by using the Buffett Indicator. For reader's information, Buffett Indicator is calculated by taking the total market capitalization over a country's GDP. Since EPOL has a portfolio of Polish stocks, the Buffett Indicator is a valid approach and can help us quickly gauge the valuation of Polish stocks.
As can be seen from the chart below, Poland's market capitalization as a percentage of the country's GDP has usually been in the range of 40% ~ 70% and has been on a declining trend since 2014. In 2014, this number was above 70%, but it has now fallen to only slightly above 40% last year. Therefore, we do not think Polish stocks are expensive. In fact, they look very cheap right now.
CEICDATA.COM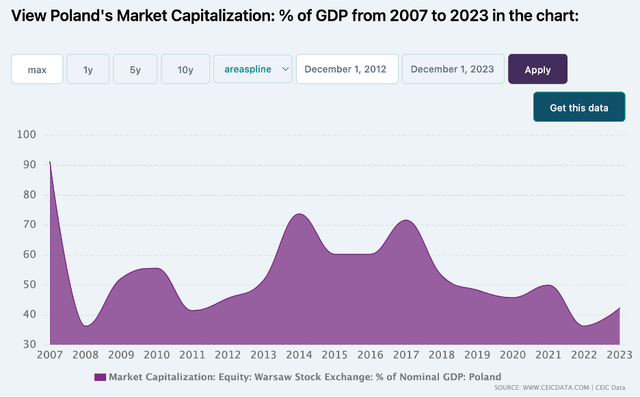
Currency risk
Like any other ETFs that focuses on non-U.S. stocks, there is currency risk involved. The strength and weakness of the Polish Zloty can impact EPOL's fund price. As the chart below shows, the Polish Zloty has been on a declining trend in the past 10 years and has fallen by 16.4% in the past 10 years. At one point towards the end of 2022, the Polish Zloty has fallen as much as 35% from the level in 2014. Therefore, investors should not neglect this risk.
YCharts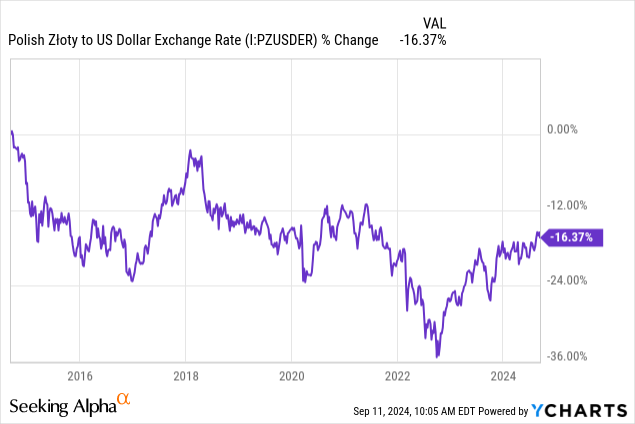
Investor Takeaway
While EPOL appears to be attractively valued based on the Buffett Indicator, its growth outlook remains weak. As such, EPOL's performance will likely continue to trail the S&P 500 index. Therefore, investors may want to seek other funds instead.
免責聲明:投資有風險,本文並非投資建議,以上內容不應被視為任何金融產品的購買或出售要約、建議或邀請,作者或其他用戶的任何相關討論、評論或帖子也不應被視為此類內容。本文僅供一般參考,不考慮您的個人投資目標、財務狀況或需求。TTM對信息的準確性和完整性不承擔任何責任或保證,投資者應自行研究並在投資前尋求專業建議。
熱議股票
- 1
- 2
- 3
- 4
- 5
- 6
- 7
- 8
- 9
- 10