The Returns At Mobvista (HKG:1860) Aren't Growing
If we want to find a potential multi-bagger, often there are underlying trends that can provide clues. Ideally, a business will show two trends; firstly a growing return on capital employed (ROCE) and secondly, an increasing amount of capital employed. Put simply, these types of businesses are compounding machines, meaning they are continually reinvesting their earnings at ever-higher rates of return. Although, when we looked at Mobvista (HKG:1860), it didn't seem to tick all of these boxes.
What Is Return On Capital Employed (ROCE)?
If you haven't worked with ROCE before, it measures the 'return' (pre-tax profit) a company generates from capital employed in its business. To calculate this metric for Mobvista, this is the formula:
Return on Capital Employed = Earnings Before Interest and Tax (EBIT) ÷ (Total Assets - Current Liabilities)
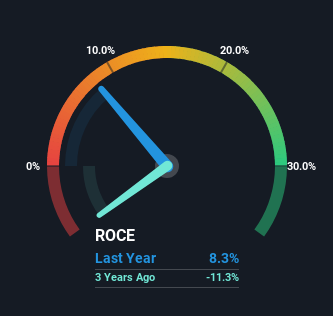
0.083 = US$21m ÷ (US$745m - US$492m) (Based on the trailing twelve months to June 2024).
Therefore, Mobvista has an ROCE of 8.3%. In absolute terms, that's a low return but it's around the Media industry average of 8.9%.
See our latest analysis for Mobvista
Above you can see how the current ROCE for Mobvista compares to its prior returns on capital, but there's only so much you can tell from the past. If you'd like to see what analysts are forecasting going forward, you should check out our free analyst report for Mobvista .
The Trend Of ROCE
Things have been pretty stable at Mobvista, with its capital employed and returns on that capital staying somewhat the same for the last five years. Businesses with these traits tend to be mature and steady operations because they're past the growth phase. With that in mind, unless investment picks up again in the future, we wouldn't expect Mobvista to be a multi-bagger going forward.
Another point to note, we noticed the company has increased current liabilities over the last five years. This is intriguing because if current liabilities hadn't increased to 66% of total assets, this reported ROCE would probably be less than8.3% because total capital employed would be higher.The 8.3% ROCE could be even lower if current liabilities weren't 66% of total assets, because the the formula would show a larger base of total capital employed. So with current liabilities at such high levels, this effectively means the likes of suppliers or short-term creditors are funding a meaningful part of the business, which in some instances can bring some risks.
The Bottom Line
We can conclude that in regards to Mobvista's returns on capital employed and the trends, there isn't much change to report on. And investors appear hesitant that the trends will pick up because the stock has fallen 66% in the last five years. Therefore based on the analysis done in this article, we don't think Mobvista has the makings of a multi-bagger.
Mobvista does have some risks though, and we've spotted 1 warning sign for Mobvista that you might be interested in.
For those who like to invest in solid companies, check out this free list of companies with solid balance sheets and high returns on equity.
New: Manage All Your Stock Portfolios in One Place
We've created the ultimate portfolio companion for stock investors, and it's free.
• Connect an unlimited number of Portfolios and see your total in one currency• Be alerted to new Warning Signs or Risks via email or mobile• Track the Fair Value of your stocks
Try a Demo Portfolio for FreeHave feedback on this article? Concerned about the content? Get in touch with us directly. Alternatively, email editorial-team (at) simplywallst.com.This article by Simply Wall St is general in nature. We provide commentary based on historical data and analyst forecasts only using an unbiased methodology and our articles are not intended to be financial advice. It does not constitute a recommendation to buy or sell any stock, and does not take account of your objectives, or your financial situation. We aim to bring you long-term focused analysis driven by fundamental data. Note that our analysis may not factor in the latest price-sensitive company announcements or qualitative material. Simply Wall St has no position in any stocks mentioned.
免責聲明:投資有風險,本文並非投資建議,以上內容不應被視為任何金融產品的購買或出售要約、建議或邀請,作者或其他用戶的任何相關討論、評論或帖子也不應被視為此類內容。本文僅供一般參考,不考慮您的個人投資目標、財務狀況或需求。TTM對信息的準確性和完整性不承擔任何責任或保證,投資者應自行研究並在投資前尋求專業建議。
熱議股票
- 1
- 2
- 3
- 4
- 5
- 6
- 7
- 8
- 9
- 10