Beonic Limited (ASX:BEO) Stock Catapults 33% Though Its Price And Business Still Lag The Industry
Beonic Limited (ASX:BEO) shareholders are no doubt pleased to see that the share price has bounced 33% in the last month, although it is still struggling to make up recently lost ground. Not all shareholders will be feeling jubilant, since the share price is still down a very disappointing 13% in the last twelve months.
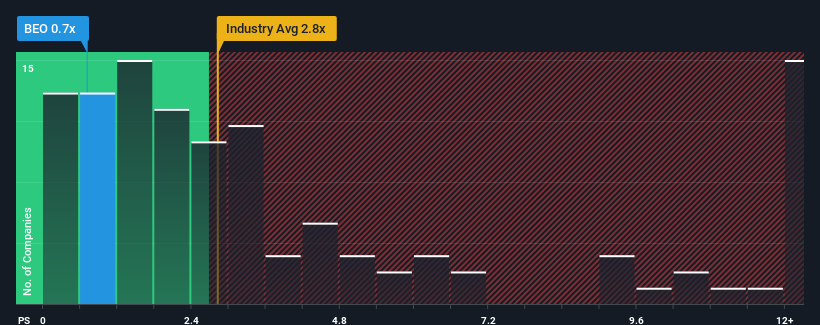
In spite of the firm bounce in price, Beonic may still be sending very bullish signals at the moment with its price-to-sales (or "P/S") ratio of 0.7x, since almost half of all companies in the Software industry in Australia have P/S ratios greater than 2.8x and even P/S higher than 7x are not unusual. Nonetheless, we'd need to dig a little deeper to determine if there is a rational basis for the highly reduced P/S.
Check out our latest analysis for Beonic
How Beonic Has Been Performing
It looks like revenue growth has deserted Beonic recently, which is not something to boast about. It might be that many expect the uninspiring revenue performance to worsen, which has repressed the P/S. If not, then existing shareholders may be feeling optimistic about the future direction of the share price.
Want the full picture on earnings, revenue and cash flow for the company? Then our free report on Beonic will help you shine a light on its historical performance.Do Revenue Forecasts Match The Low P/S Ratio?
The only time you'd be truly comfortable seeing a P/S as depressed as Beonic's is when the company's growth is on track to lag the industry decidedly.
If we review the last year of revenue, the company posted a result that saw barely any deviation from a year ago. Still, the latest three year period has seen an excellent 50% overall rise in revenue, in spite of its uninspiring short-term performance. Therefore, it's fair to say the revenue growth recently has been great for the company, but investors will want to ask why it has slowed to such an extent.
Comparing the recent medium-term revenue trends against the industry's one-year growth forecast of 23% shows it's noticeably less attractive.
With this in consideration, it's easy to understand why Beonic's P/S falls short of the mark set by its industry peers. It seems most investors are expecting to see the recent limited growth rates continue into the future and are only willing to pay a reduced amount for the stock.
The Bottom Line On Beonic's P/S
Even after such a strong price move, Beonic's P/S still trails the rest of the industry. It's argued the price-to-sales ratio is an inferior measure of value within certain industries, but it can be a powerful business sentiment indicator.
In line with expectations, Beonic maintains its low P/S on the weakness of its recent three-year growth being lower than the wider industry forecast. At this stage investors feel the potential for an improvement in revenue isn't great enough to justify a higher P/S ratio. Unless the recent medium-term conditions improve, they will continue to form a barrier for the share price around these levels.
There are also other vital risk factors to consider and we've discovered 4 warning signs for Beonic (1 doesn't sit too well with us!) that you should be aware of before investing here.
Of course, profitable companies with a history of great earnings growth are generally safer bets. So you may wish to see this free collection of other companies that have reasonable P/E ratios and have grown earnings strongly.
Valuation is complex, but we're here to simplify it.
Discover if Beonic might be undervalued or overvalued with our detailed analysis, featuring fair value estimates, potential risks, dividends, insider trades, and its financial condition.
Access Free AnalysisHave feedback on this article? Concerned about the content? Get in touch with us directly. Alternatively, email editorial-team (at) simplywallst.com.This article by Simply Wall St is general in nature. We provide commentary based on historical data and analyst forecasts only using an unbiased methodology and our articles are not intended to be financial advice. It does not constitute a recommendation to buy or sell any stock, and does not take account of your objectives, or your financial situation. We aim to bring you long-term focused analysis driven by fundamental data. Note that our analysis may not factor in the latest price-sensitive company announcements or qualitative material. Simply Wall St has no position in any stocks mentioned.
免責聲明:投資有風險,本文並非投資建議,以上內容不應被視為任何金融產品的購買或出售要約、建議或邀請,作者或其他用戶的任何相關討論、評論或帖子也不應被視為此類內容。本文僅供一般參考,不考慮您的個人投資目標、財務狀況或需求。TTM對信息的準確性和完整性不承擔任何責任或保證,投資者應自行研究並在投資前尋求專業建議。
熱議股票
- 1
- 2
- 3
- 4
- 5
- 6
- 7
- 8
- 9
- 10