Ramelius Resources Limited's (ASX:RMS) Stock On An Uptrend: Could Fundamentals Be Driving The Momentum?
Most readers would already be aware that Ramelius Resources' (ASX:RMS) stock increased significantly by 10% over the past three months. As most would know, fundamentals are what usually guide market price movements over the long-term, so we decided to look at the company's key financial indicators today to determine if they have any role to play in the recent price movement. Specifically, we decided to study Ramelius Resources' ROE in this article.
ROE or return on equity is a useful tool to assess how effectively a company can generate returns on the investment it received from its shareholders. In simpler terms, it measures the profitability of a company in relation to shareholder's equity.
View our latest analysis for Ramelius Resources
How Is ROE Calculated?
Return on equity can be calculated by using the formula:
Return on Equity = Net Profit (from continuing operations) ÷ Shareholders' Equity
So, based on the above formula, the ROE for Ramelius Resources is:
16% = AU$217m ÷ AU$1.3b (Based on the trailing twelve months to June 2024).
The 'return' is the yearly profit. Another way to think of that is that for every A$1 worth of equity, the company was able to earn A$0.16 in profit.
What Is The Relationship Between ROE And Earnings Growth?
Thus far, we have learned that ROE measures how efficiently a company is generating its profits. We now need to evaluate how much profit the company reinvests or "retains" for future growth which then gives us an idea about the growth potential of the company. Assuming all else is equal, companies that have both a higher return on equity and higher profit retention are usually the ones that have a higher growth rate when compared to companies that don't have the same features.
Ramelius Resources' Earnings Growth And 16% ROE
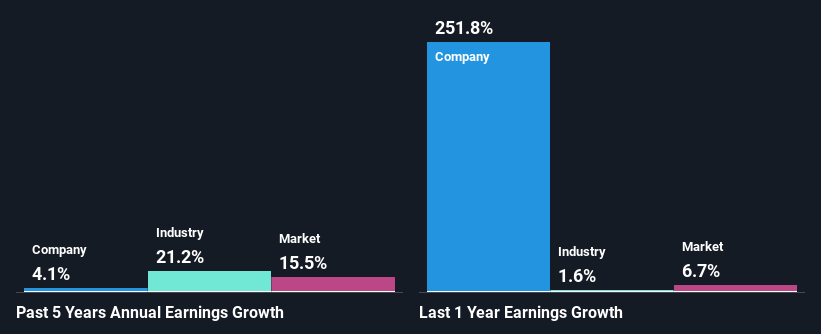
To start with, Ramelius Resources' ROE looks acceptable. On comparing with the average industry ROE of 12% the company's ROE looks pretty remarkable. Despite this, Ramelius Resources' five year net income growth was quite low averaging at only 4.1%. That's a bit unexpected from a company which has such a high rate of return. Such a scenario is likely to take place when a company pays out a huge portion of its earnings as dividends, or is faced with competitive pressures.
As a next step, we compared Ramelius Resources' net income growth with the industry and were disappointed to see that the company's growth is lower than the industry average growth of 21% in the same period.
Earnings growth is a huge factor in stock valuation. The investor should try to establish if the expected growth or decline in earnings, whichever the case may be, is priced in. This then helps them determine if the stock is placed for a bright or bleak future. If you're wondering about Ramelius Resources''s valuation, check out this gauge of its price-to-earnings ratio, as compared to its industry.
Is Ramelius Resources Using Its Retained Earnings Effectively?
While Ramelius Resources has a decent three-year median payout ratio of 26% (or a retention ratio of 74%), it has seen very little growth in earnings. Therefore, there might be some other reasons to explain the lack in that respect. For example, the business could be in decline.
Additionally, Ramelius Resources has paid dividends over a period of five years, which means that the company's management is determined to pay dividends even if it means little to no earnings growth. Upon studying the latest analysts' consensus data, we found that the company's future payout ratio is expected to drop to 19% over the next three years. Still forecasts suggest that Ramelius Resources' future ROE will drop to 10% even though the the company's payout ratio is expected to decrease. This suggests that there could be other factors could driving the anticipated decline in the company's ROE.
Summary
On the whole, we do feel that Ramelius Resources has some positive attributes. Yet, the low earnings growth is a bit concerning, especially given that the company has a high rate of return and is reinvesting ma huge portion of its profits. By the looks of it, there could be some other factors, not necessarily in control of the business, that's preventing growth. Having said that, the company's earnings growth is expected to slow down, as forecasted in the current analyst estimates. Are these analysts expectations based on the broad expectations for the industry, or on the company's fundamentals? Click here to be taken to our analyst's forecasts page for the company.
New: AI Stock Screener & Alerts
Our new AI Stock Screener scans the market every day to uncover opportunities.
• Dividend Powerhouses (3%+ Yield)• Undervalued Small Caps with Insider Buying• High growth Tech and AI CompaniesOr build your own from over 50 metrics.
Explore Now for FreeHave feedback on this article? Concerned about the content? Get in touch with us directly. Alternatively, email editorial-team (at) simplywallst.com.This article by Simply Wall St is general in nature. We provide commentary based on historical data and analyst forecasts only using an unbiased methodology and our articles are not intended to be financial advice. It does not constitute a recommendation to buy or sell any stock, and does not take account of your objectives, or your financial situation. We aim to bring you long-term focused analysis driven by fundamental data. Note that our analysis may not factor in the latest price-sensitive company announcements or qualitative material. Simply Wall St has no position in any stocks mentioned.
免責聲明:投資有風險,本文並非投資建議,以上內容不應被視為任何金融產品的購買或出售要約、建議或邀請,作者或其他用戶的任何相關討論、評論或帖子也不應被視為此類內容。本文僅供一般參考,不考慮您的個人投資目標、財務狀況或需求。TTM對信息的準確性和完整性不承擔任何責任或保證,投資者應自行研究並在投資前尋求專業建議。
熱議股票
- 1
- 2
- 3
- 4
- 5
- 6
- 7
- 8
- 9
- 10