Many Still Looking Away From Zengame Technology Holding Limited (HKG:2660)
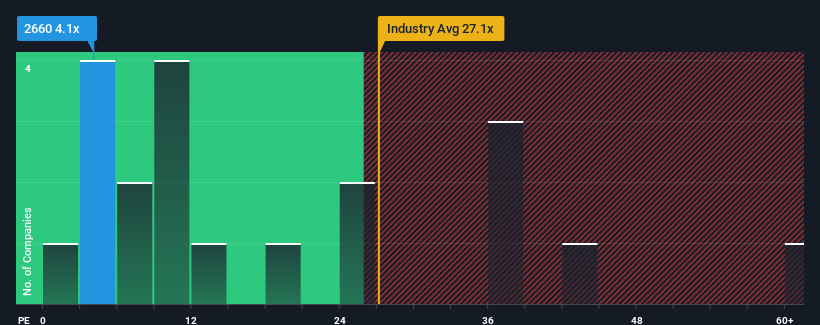
With a price-to-earnings (or "P/E") ratio of 4.1x Zengame Technology Holding Limited (HKG:2660) may be sending very bullish signals at the moment, given that almost half of all companies in Hong Kong have P/E ratios greater than 10x and even P/E's higher than 20x are not unusual. However, the P/E might be quite low for a reason and it requires further investigation to determine if it's justified.
As an illustration, earnings have deteriorated at Zengame Technology Holding over the last year, which is not ideal at all. One possibility is that the P/E is low because investors think the company won't do enough to avoid underperforming the broader market in the near future. If you like the company, you'd be hoping this isn't the case so that you could potentially pick up some stock while it's out of favour.
Check out our latest analysis for Zengame Technology Holding
What Are Growth Metrics Telling Us About The Low P/E?
The only time you'd be truly comfortable seeing a P/E as depressed as Zengame Technology Holding's is when the company's growth is on track to lag the market decidedly.
Retrospectively, the last year delivered a frustrating 26% decrease to the company's bottom line. Still, the latest three year period has seen an excellent 170% overall rise in EPS, in spite of its unsatisfying short-term performance. Although it's been a bumpy ride, it's still fair to say the earnings growth recently has been more than adequate for the company.
Weighing that recent medium-term earnings trajectory against the broader market's one-year forecast for expansion of 22% shows it's noticeably more attractive on an annualised basis.
With this information, we find it odd that Zengame Technology Holding is trading at a P/E lower than the market. It looks like most investors are not convinced the company can maintain its recent growth rates.
The Bottom Line On Zengame Technology Holding's P/E
It's argued the price-to-earnings ratio is an inferior measure of value within certain industries, but it can be a powerful business sentiment indicator.
Our examination of Zengame Technology Holding revealed its three-year earnings trends aren't contributing to its P/E anywhere near as much as we would have predicted, given they look better than current market expectations. When we see strong earnings with faster-than-market growth, we assume potential risks are what might be placing significant pressure on the P/E ratio. It appears many are indeed anticipating earnings instability, because the persistence of these recent medium-term conditions would normally provide a boost to the share price.
You should always think about risks. Case in point, we've spotted 1 warning sign for Zengame Technology Holding you should be aware of.
If P/E ratios interest you, you may wish to see this free collection of other companies with strong earnings growth and low P/E ratios.
Valuation is complex, but we're here to simplify it.
Discover if Zengame Technology Holding might be undervalued or overvalued with our detailed analysis, featuring fair value estimates, potential risks, dividends, insider trades, and its financial condition.
Access Free AnalysisHave feedback on this article? Concerned about the content? Get in touch with us directly. Alternatively, email editorial-team (at) simplywallst.com.This article by Simply Wall St is general in nature. We provide commentary based on historical data and analyst forecasts only using an unbiased methodology and our articles are not intended to be financial advice. It does not constitute a recommendation to buy or sell any stock, and does not take account of your objectives, or your financial situation. We aim to bring you long-term focused analysis driven by fundamental data. Note that our analysis may not factor in the latest price-sensitive company announcements or qualitative material. Simply Wall St has no position in any stocks mentioned.
免責聲明:投資有風險,本文並非投資建議,以上內容不應被視為任何金融產品的購買或出售要約、建議或邀請,作者或其他用戶的任何相關討論、評論或帖子也不應被視為此類內容。本文僅供一般參考,不考慮您的個人投資目標、財務狀況或需求。TTM對信息的準確性和完整性不承擔任何責任或保證,投資者應自行研究並在投資前尋求專業建議。
熱議股票
- 1
- 2
- 3
- 4
- 5
- 6
- 7
- 8
- 9
- 10