Are Strong Financial Prospects The Force That Is Driving The Momentum In Xinyi Solar Holdings Limited's HKG:968) Stock?
Xinyi Solar Holdings (HKG:968) has had a great run on the share market with its stock up by a significant 28% over the last month. Since the market usually pay for a company’s long-term fundamentals, we decided to study the company’s key performance indicators to see if they could be influencing the market. Particularly, we will be paying attention to Xinyi Solar Holdings' ROE today.
Return on equity or ROE is a key measure used to assess how efficiently a company's management is utilizing the company's capital. In simpler terms, it measures the profitability of a company in relation to shareholder's equity.
Check out our latest analysis for Xinyi Solar Holdings
How Is ROE Calculated?
The formula for return on equity is:
Return on Equity = Net Profit (from continuing operations) ÷ Shareholders' Equity
So, based on the above formula, the ROE for Xinyi Solar Holdings is:
14% = HK$5.2b ÷ HK$37b (Based on the trailing twelve months to June 2024).
The 'return' is the profit over the last twelve months. One way to conceptualize this is that for each HK$1 of shareholders' capital it has, the company made HK$0.14 in profit.
What Has ROE Got To Do With Earnings Growth?
We have already established that ROE serves as an efficient profit-generating gauge for a company's future earnings. We now need to evaluate how much profit the company reinvests or "retains" for future growth which then gives us an idea about the growth potential of the company. Assuming everything else remains unchanged, the higher the ROE and profit retention, the higher the growth rate of a company compared to companies that don't necessarily bear these characteristics.
A Side By Side comparison of Xinyi Solar Holdings' Earnings Growth And 14% ROE
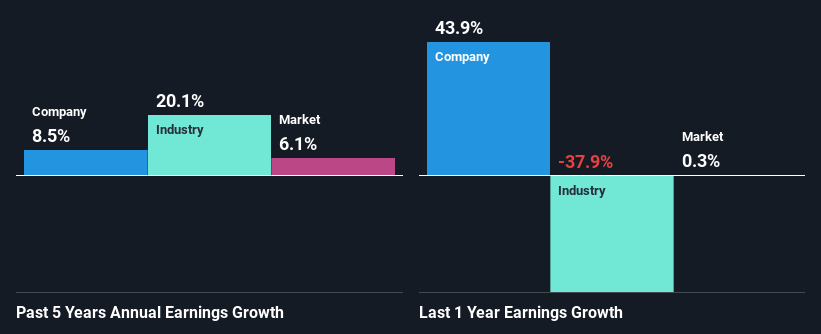
To begin with, Xinyi Solar Holdings seems to have a respectable ROE. Further, the company's ROE compares quite favorably to the industry average of 8.2%. Probably as a result of this, Xinyi Solar Holdings was able to see a decent growth of 8.5% over the last five years.
We then compared Xinyi Solar Holdings' net income growth with the industry and found that the company's growth figure is lower than the average industry growth rate of 20% in the same 5-year period, which is a bit concerning.
Earnings growth is a huge factor in stock valuation. The investor should try to establish if the expected growth or decline in earnings, whichever the case may be, is priced in. This then helps them determine if the stock is placed for a bright or bleak future. One good indicator of expected earnings growth is the P/E ratio which determines the price the market is willing to pay for a stock based on its earnings prospects. So, you may want to check if Xinyi Solar Holdings is trading on a high P/E or a low P/E, relative to its industry.
Is Xinyi Solar Holdings Efficiently Re-investing Its Profits?
With a three-year median payout ratio of 47% (implying that the company retains 53% of its profits), it seems that Xinyi Solar Holdings is reinvesting efficiently in a way that it sees respectable amount growth in its earnings and pays a dividend that's well covered.
Besides, Xinyi Solar Holdings has been paying dividends for at least ten years or more. This shows that the company is committed to sharing profits with its shareholders. Our latest analyst data shows that the future payout ratio of the company over the next three years is expected to be approximately 47%. As a result, Xinyi Solar Holdings' ROE is not expected to change by much either, which we inferred from the analyst estimate of 15% for future ROE.
Summary
On the whole, we feel that Xinyi Solar Holdings' performance has been quite good. In particular, it's great to see that the company is investing heavily into its business and along with a high rate of return, that has resulted in a respectable growth in its earnings. That being so, the latest analyst forecasts show that the company will continue to see an expansion in its earnings. To know more about the company's future earnings growth forecasts take a look at this free report on analyst forecasts for the company to find out more.
New: AI Stock Screener & Alerts
Our new AI Stock Screener scans the market every day to uncover opportunities.
• Dividend Powerhouses (3%+ Yield)• Undervalued Small Caps with Insider Buying• High growth Tech and AI CompaniesOr build your own from over 50 metrics.
Explore Now for FreeHave feedback on this article? Concerned about the content? Get in touch with us directly. Alternatively, email editorial-team (at) simplywallst.com.This article by Simply Wall St is general in nature. We provide commentary based on historical data and analyst forecasts only using an unbiased methodology and our articles are not intended to be financial advice. It does not constitute a recommendation to buy or sell any stock, and does not take account of your objectives, or your financial situation. We aim to bring you long-term focused analysis driven by fundamental data. Note that our analysis may not factor in the latest price-sensitive company announcements or qualitative material. Simply Wall St has no position in any stocks mentioned.
免責聲明:投資有風險,本文並非投資建議,以上內容不應被視為任何金融產品的購買或出售要約、建議或邀請,作者或其他用戶的任何相關討論、評論或帖子也不應被視為此類內容。本文僅供一般參考,不考慮您的個人投資目標、財務狀況或需求。TTM對信息的準確性和完整性不承擔任何責任或保證,投資者應自行研究並在投資前尋求專業建議。
熱議股票
- 1
- 2
- 3
- 4
- 5
- 6
- 7
- 8
- 9
- 10