We're Hopeful That Bannerman Energy (ASX:BMN) Will Use Its Cash Wisely
Just because a business does not make any money, does not mean that the stock will go down. For example, although Amazon.com made losses for many years after listing, if you had bought and held the shares since 1999, you would have made a fortune. But while history lauds those rare successes, those that fail are often forgotten; who remembers Pets.com?
Given this risk, we thought we'd take a look at whether Bannerman Energy (ASX:BMN) shareholders should be worried about its cash burn. For the purpose of this article, we'll define cash burn as the amount of cash the company is spending each year to fund its growth (also called its negative free cash flow). First, we'll determine its cash runway by comparing its cash burn with its cash reserves.
See our latest analysis for Bannerman Energy
Does Bannerman Energy Have A Long Cash Runway?
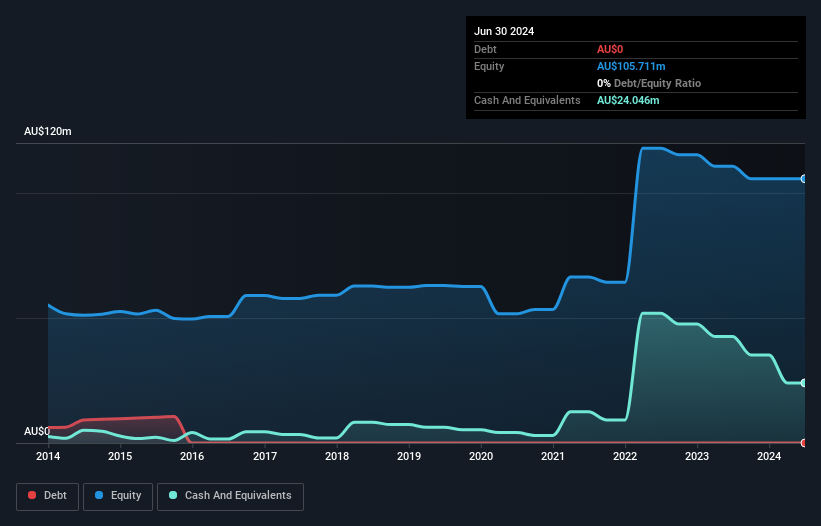
You can calculate a company's cash runway by dividing the amount of cash it has by the rate at which it is spending that cash. When Bannerman Energy last reported its June 2024 balance sheet in September 2024, it had zero debt and cash worth AU$24m. Importantly, its cash burn was AU$18m over the trailing twelve months. That means it had a cash runway of around 16 months as of June 2024. Importantly, analysts think that Bannerman Energy will reach cashflow breakeven in 3 years. That means unless the company reduces its cash burn quickly, it may well look to raise more cash. The image below shows how its cash balance has been changing over the last few years.
How Is Bannerman Energy's Cash Burn Changing Over Time?
Because Bannerman Energy isn't currently generating revenue, we consider it an early-stage business. So while we can't look to sales to understand growth, we can look at how the cash burn is changing to understand how expenditure is trending over time. During the last twelve months, its cash burn actually ramped up 96%. While this spending increase is no doubt intended to drive growth, if the trend continues the company's cash runway will shrink very quickly. While the past is always worth studying, it is the future that matters most of all. So you might want to take a peek at how much the company is expected to grow in the next few years.
How Easily Can Bannerman Energy Raise Cash?
Given its cash burn trajectory, Bannerman Energy shareholders may wish to consider how easily it could raise more cash, despite its solid cash runway. Issuing new shares, or taking on debt, are the most common ways for a listed company to raise more money for its business. Commonly, a business will sell new shares in itself to raise cash and drive growth. We can compare a company's cash burn to its market capitalisation to get a sense for how many new shares a company would have to issue to fund one year's operations.
Since it has a market capitalisation of AU$566m, Bannerman Energy's AU$18m in cash burn equates to about 3.2% of its market value. That's a low proportion, so we figure the company would be able to raise more cash to fund growth, with a little dilution, or even to simply borrow some money.
So, Should We Worry About Bannerman Energy's Cash Burn?
Even though its increasing cash burn makes us a little nervous, we are compelled to mention that we thought Bannerman Energy's cash burn relative to its market cap was relatively promising. One real positive is that analysts are forecasting that the company will reach breakeven. Cash burning companies are always on the riskier side of things, but after considering all of the factors discussed in this short piece, we're not too worried about its rate of cash burn. Taking a deeper dive, we've spotted 3 warning signs for Bannerman Energy you should be aware of, and 2 of them don't sit too well with us.
Of course, you might find a fantastic investment by looking elsewhere. So take a peek at this free list of interesting companies, and this list of stocks growth stocks (according to analyst forecasts)
Valuation is complex, but we're here to simplify it.
Discover if Bannerman Energy might be undervalued or overvalued with our detailed analysis, featuring fair value estimates, potential risks, dividends, insider trades, and its financial condition.
Access Free AnalysisHave feedback on this article? Concerned about the content? Get in touch with us directly. Alternatively, email editorial-team (at) simplywallst.com.This article by Simply Wall St is general in nature. We provide commentary based on historical data and analyst forecasts only using an unbiased methodology and our articles are not intended to be financial advice. It does not constitute a recommendation to buy or sell any stock, and does not take account of your objectives, or your financial situation. We aim to bring you long-term focused analysis driven by fundamental data. Note that our analysis may not factor in the latest price-sensitive company announcements or qualitative material. Simply Wall St has no position in any stocks mentioned.
免責聲明:投資有風險,本文並非投資建議,以上內容不應被視為任何金融產品的購買或出售要約、建議或邀請,作者或其他用戶的任何相關討論、評論或帖子也不應被視為此類內容。本文僅供一般參考,不考慮您的個人投資目標、財務狀況或需求。TTM對信息的準確性和完整性不承擔任何責任或保證,投資者應自行研究並在投資前尋求專業建議。
熱議股票
- 1
- 2
- 3
- 4
- 5
- 6
- 7
- 8
- 9
- 10