Returns On Capital Are A Standout For China Automotive Interior Decoration Holdings (HKG:48)
There are a few key trends to look for if we want to identify the next multi-bagger. In a perfect world, we'd like to see a company investing more capital into its business and ideally the returns earned from that capital are also increasing. If you see this, it typically means it's a company with a great business model and plenty of profitable reinvestment opportunities. Speaking of which, we noticed some great changes in China Automotive Interior Decoration Holdings' (HKG:48) returns on capital, so let's have a look.
Return On Capital Employed (ROCE): What Is It?
For those that aren't sure what ROCE is, it measures the amount of pre-tax profits a company can generate from the capital employed in its business. To calculate this metric for China Automotive Interior Decoration Holdings, this is the formula:
Return on Capital Employed = Earnings Before Interest and Tax (EBIT) ÷ (Total Assets - Current Liabilities)
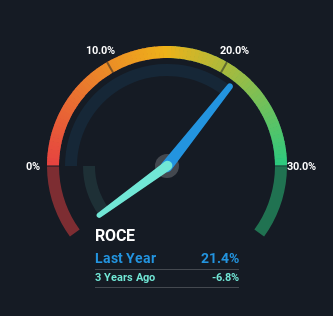
0.21 = CN¥31m ÷ (CN¥250m - CN¥105m) (Based on the trailing twelve months to June 2024).
Thus, China Automotive Interior Decoration Holdings has an ROCE of 21%. That's a fantastic return and not only that, it outpaces the average of 6.3% earned by companies in a similar industry.
Check out our latest analysis for China Automotive Interior Decoration Holdings
While the past is not representative of the future, it can be helpful to know how a company has performed historically, which is why we have this chart above. If you're interested in investigating China Automotive Interior Decoration Holdings' past further, check out this free graph covering China Automotive Interior Decoration Holdings' past earnings, revenue and cash flow.
The Trend Of ROCE
We're delighted to see that China Automotive Interior Decoration Holdings is reaping rewards from its investments and has now broken into profitability. The company was generating losses five years ago, but now it's turned around, earning 21% which is no doubt a relief for some early shareholders. At first glance, it seems the business is getting more proficient at generating returns, because over the same period, the amount of capital employed has reduced by 22%. The reduction could indicate that the company is selling some assets, and considering returns are up, they appear to be selling the right ones.
On a side note, China Automotive Interior Decoration Holdings' current liabilities are still rather high at 42% of total assets. This effectively means that suppliers (or short-term creditors) are funding a large portion of the business, so just be aware that this can introduce some elements of risk. Ideally we'd like to see this reduce as that would mean fewer obligations bearing risks.
In Conclusion...
From what we've seen above, China Automotive Interior Decoration Holdings has managed to increase it's returns on capital all the while reducing it's capital base. Although the company may be facing some issues elsewhere since the stock has plunged 82% in the last five years. Regardless, we think the underlying fundamentals warrant this stock for further investigation.
If you want to know some of the risks facing China Automotive Interior Decoration Holdings we've found 3 warning signs (2 shouldn't be ignored!) that you should be aware of before investing here.
If you want to search for more stocks that have been earning high returns, check out this free list of stocks with solid balance sheets that are also earning high returns on equity.
New: AI Stock Screener & Alerts
Our new AI Stock Screener scans the market every day to uncover opportunities.
• Dividend Powerhouses (3%+ Yield)• Undervalued Small Caps with Insider Buying• High growth Tech and AI CompaniesOr build your own from over 50 metrics.
Explore Now for FreeHave feedback on this article? Concerned about the content? Get in touch with us directly. Alternatively, email editorial-team (at) simplywallst.com.This article by Simply Wall St is general in nature. We provide commentary based on historical data and analyst forecasts only using an unbiased methodology and our articles are not intended to be financial advice. It does not constitute a recommendation to buy or sell any stock, and does not take account of your objectives, or your financial situation. We aim to bring you long-term focused analysis driven by fundamental data. Note that our analysis may not factor in the latest price-sensitive company announcements or qualitative material. Simply Wall St has no position in any stocks mentioned.
免責聲明:投資有風險,本文並非投資建議,以上內容不應被視為任何金融產品的購買或出售要約、建議或邀請,作者或其他用戶的任何相關討論、評論或帖子也不應被視為此類內容。本文僅供一般參考,不考慮您的個人投資目標、財務狀況或需求。TTM對信息的準確性和完整性不承擔任何責任或保證,投資者應自行研究並在投資前尋求專業建議。
熱議股票
- 1
- 2
- 3
- 4
- 5
- 6
- 7
- 8
- 9
- 10