Dogecoin (DOGE) Price Shows Strong Bullish Sentiment as Buyers Gain Control
- Dogecoin shows bullish signs with price trading above Ichimoku Cloud, though trend strength remains uncertain.
- EMA lines and slight buyer control indicate upward potential; watch key support and resistance levels.
- ADX low in DMI chart signals a weak trend, needing stronger buyer momentum for a firm uptrend confirmation.
Dogecoin (DOGE) price is showing signs of bullish momentum, as recent technical indicators point toward potential gains. The Ichimoku Cloud, EMA lines, and DMI all suggest positive movement, though the strength of the trend is still uncertain.
Buyers are gaining control, but the momentum needs to strengthen to confirm a solid uptrend. Traders should watch key support and resistance levels for indications of where the DOGE price might head next.
DOGE Ichimoku Cloud Shows a Bullish Setting
The Ichimoku Cloud on the 4-hour chart shows a bullish sentiment, with DOGE trading above the green Kumo. This suggests strong buyer control and positive momentum.
The cloud’s current thickness provides a solid support level, implying that any downward corrections may be limited unless bearish pressure increases significantly.
Read more: Dogecoin (DOGE) vs Shiba Inu (SHIB): What’s the Difference?
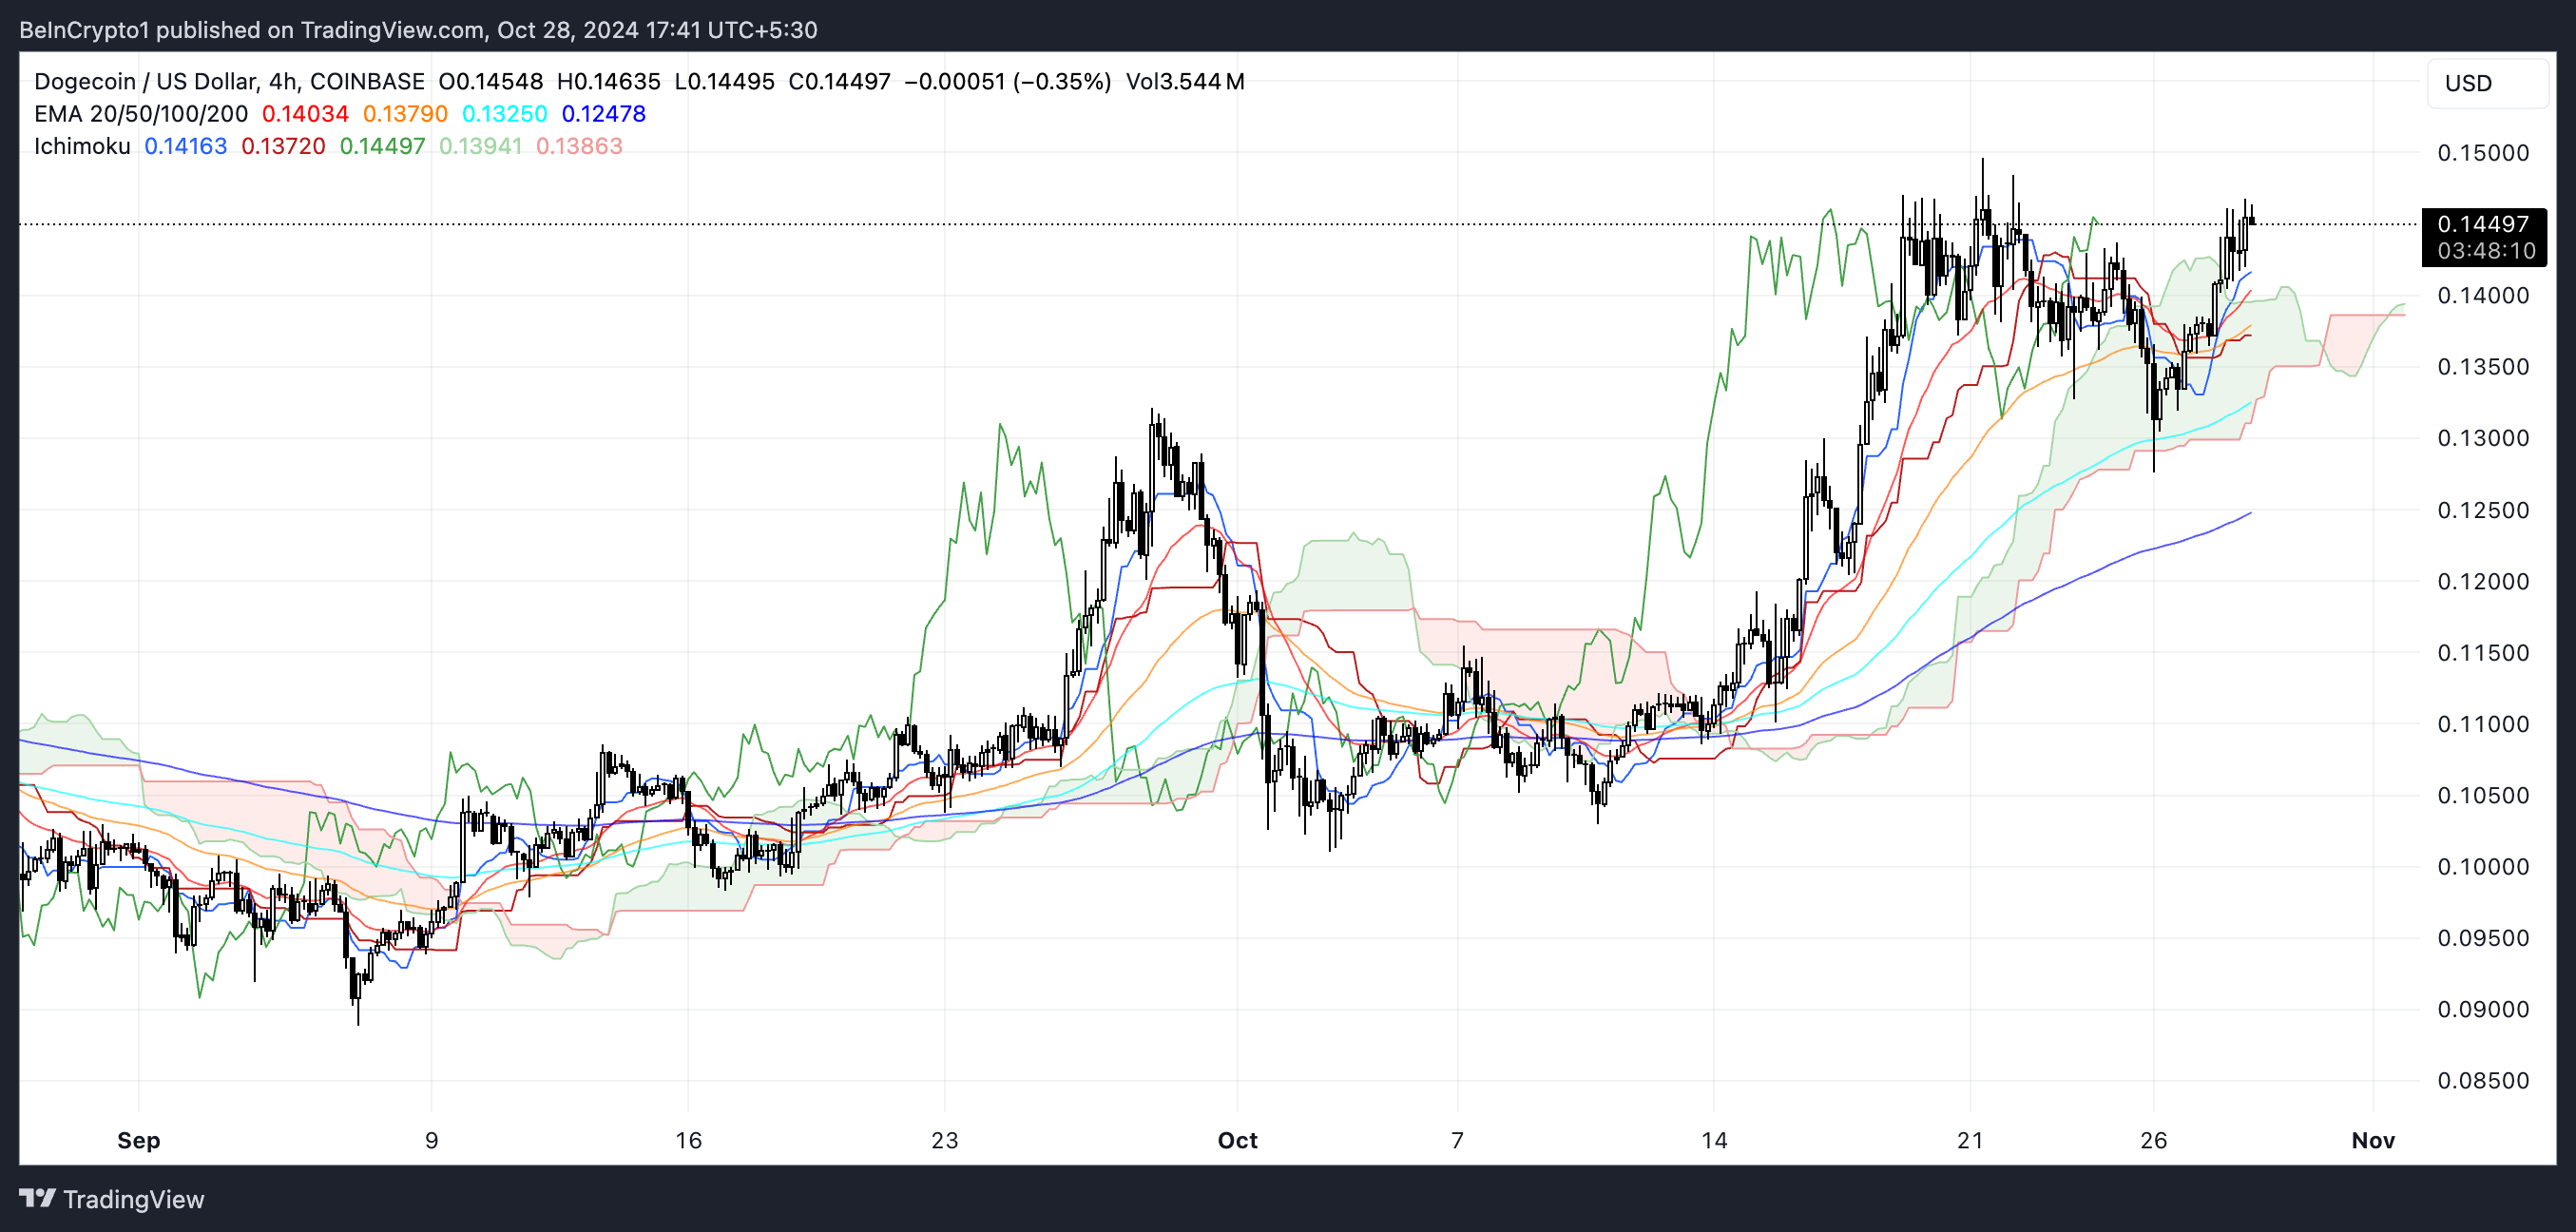
The Tenkan-sen (red line) recently crossed above the Kijun-sen (blue line), signaling short-term strength and a likely continuation of the uptrend.
Additionally, the Chikou Span (green line) is positioned well above the price curve, further supporting the bullish outlook. To maintain this positive trend, the price must remain above the cloud while the Kumo stays green.
Dogecoin Current Trend is Still Not That Strong
The Directional Movement Index (DMI) chart for Dogecoin shows mixed signals regarding the strength of the current trend. The yellow line represents the Average Directional Index (ADX), which measures trend strength.
Currently, the ADX is below 20, indicating that there is no strong trend in place at the moment. When the ADX value is low, it typically means that the market is ranging or lacking clear direction.
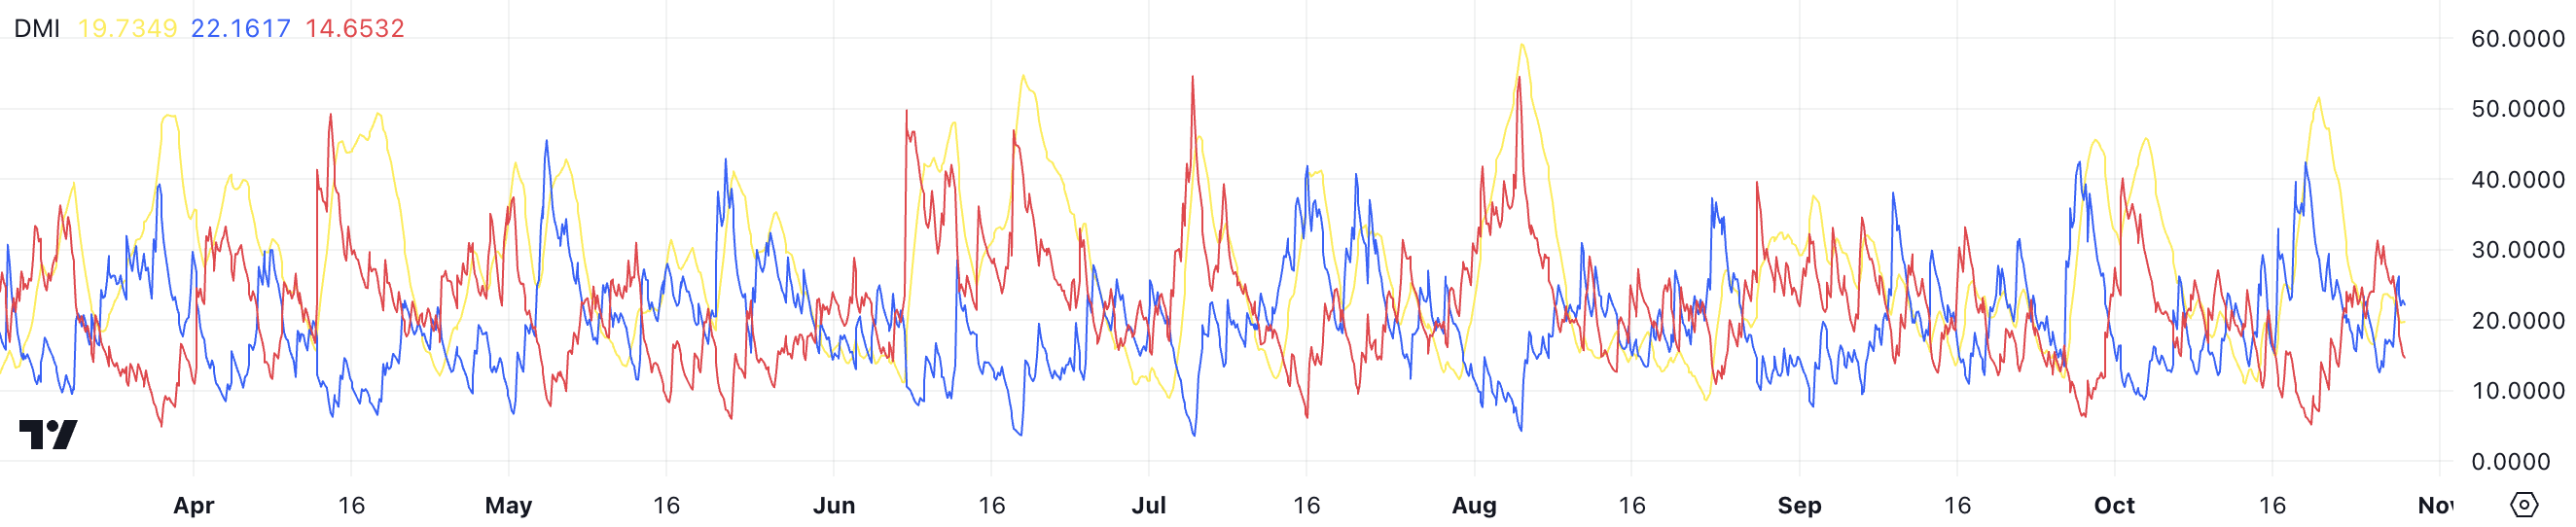
The blue line (+DI) and red line (-DI) represent buying and selling pressure, respectively. The +DI is slightly above the -DI, indicating that buyers have a slight edge over sellers. However, with both lines relatively close together, this suggests that the buying momentum is not overwhelmingly strong.
For a stronger signal, a wider separation between +DI and -DI would be needed, accompanied by an increasing ADX value, which would confirm a solid trend direction for DOGE.
DOGE Price Prediction: Biggest Price Since April?
The EMA lines on the 4-hour chart for Dogecoin price suggest a mixed trend with some bullish signs. The price is sitting above all EMA lines: this alignment generally indicates that the short-term to long-term momentum is in favor of the bulls, suggesting upward movement.
As indicated by the red lines, immediate support is found around the $0.11996 and $0.10858 levels. These levels have previously acted as strong zones where buyers stepped in.
Read more: Dogecoin (DOGE) Price Prediction 2024/2025/2030
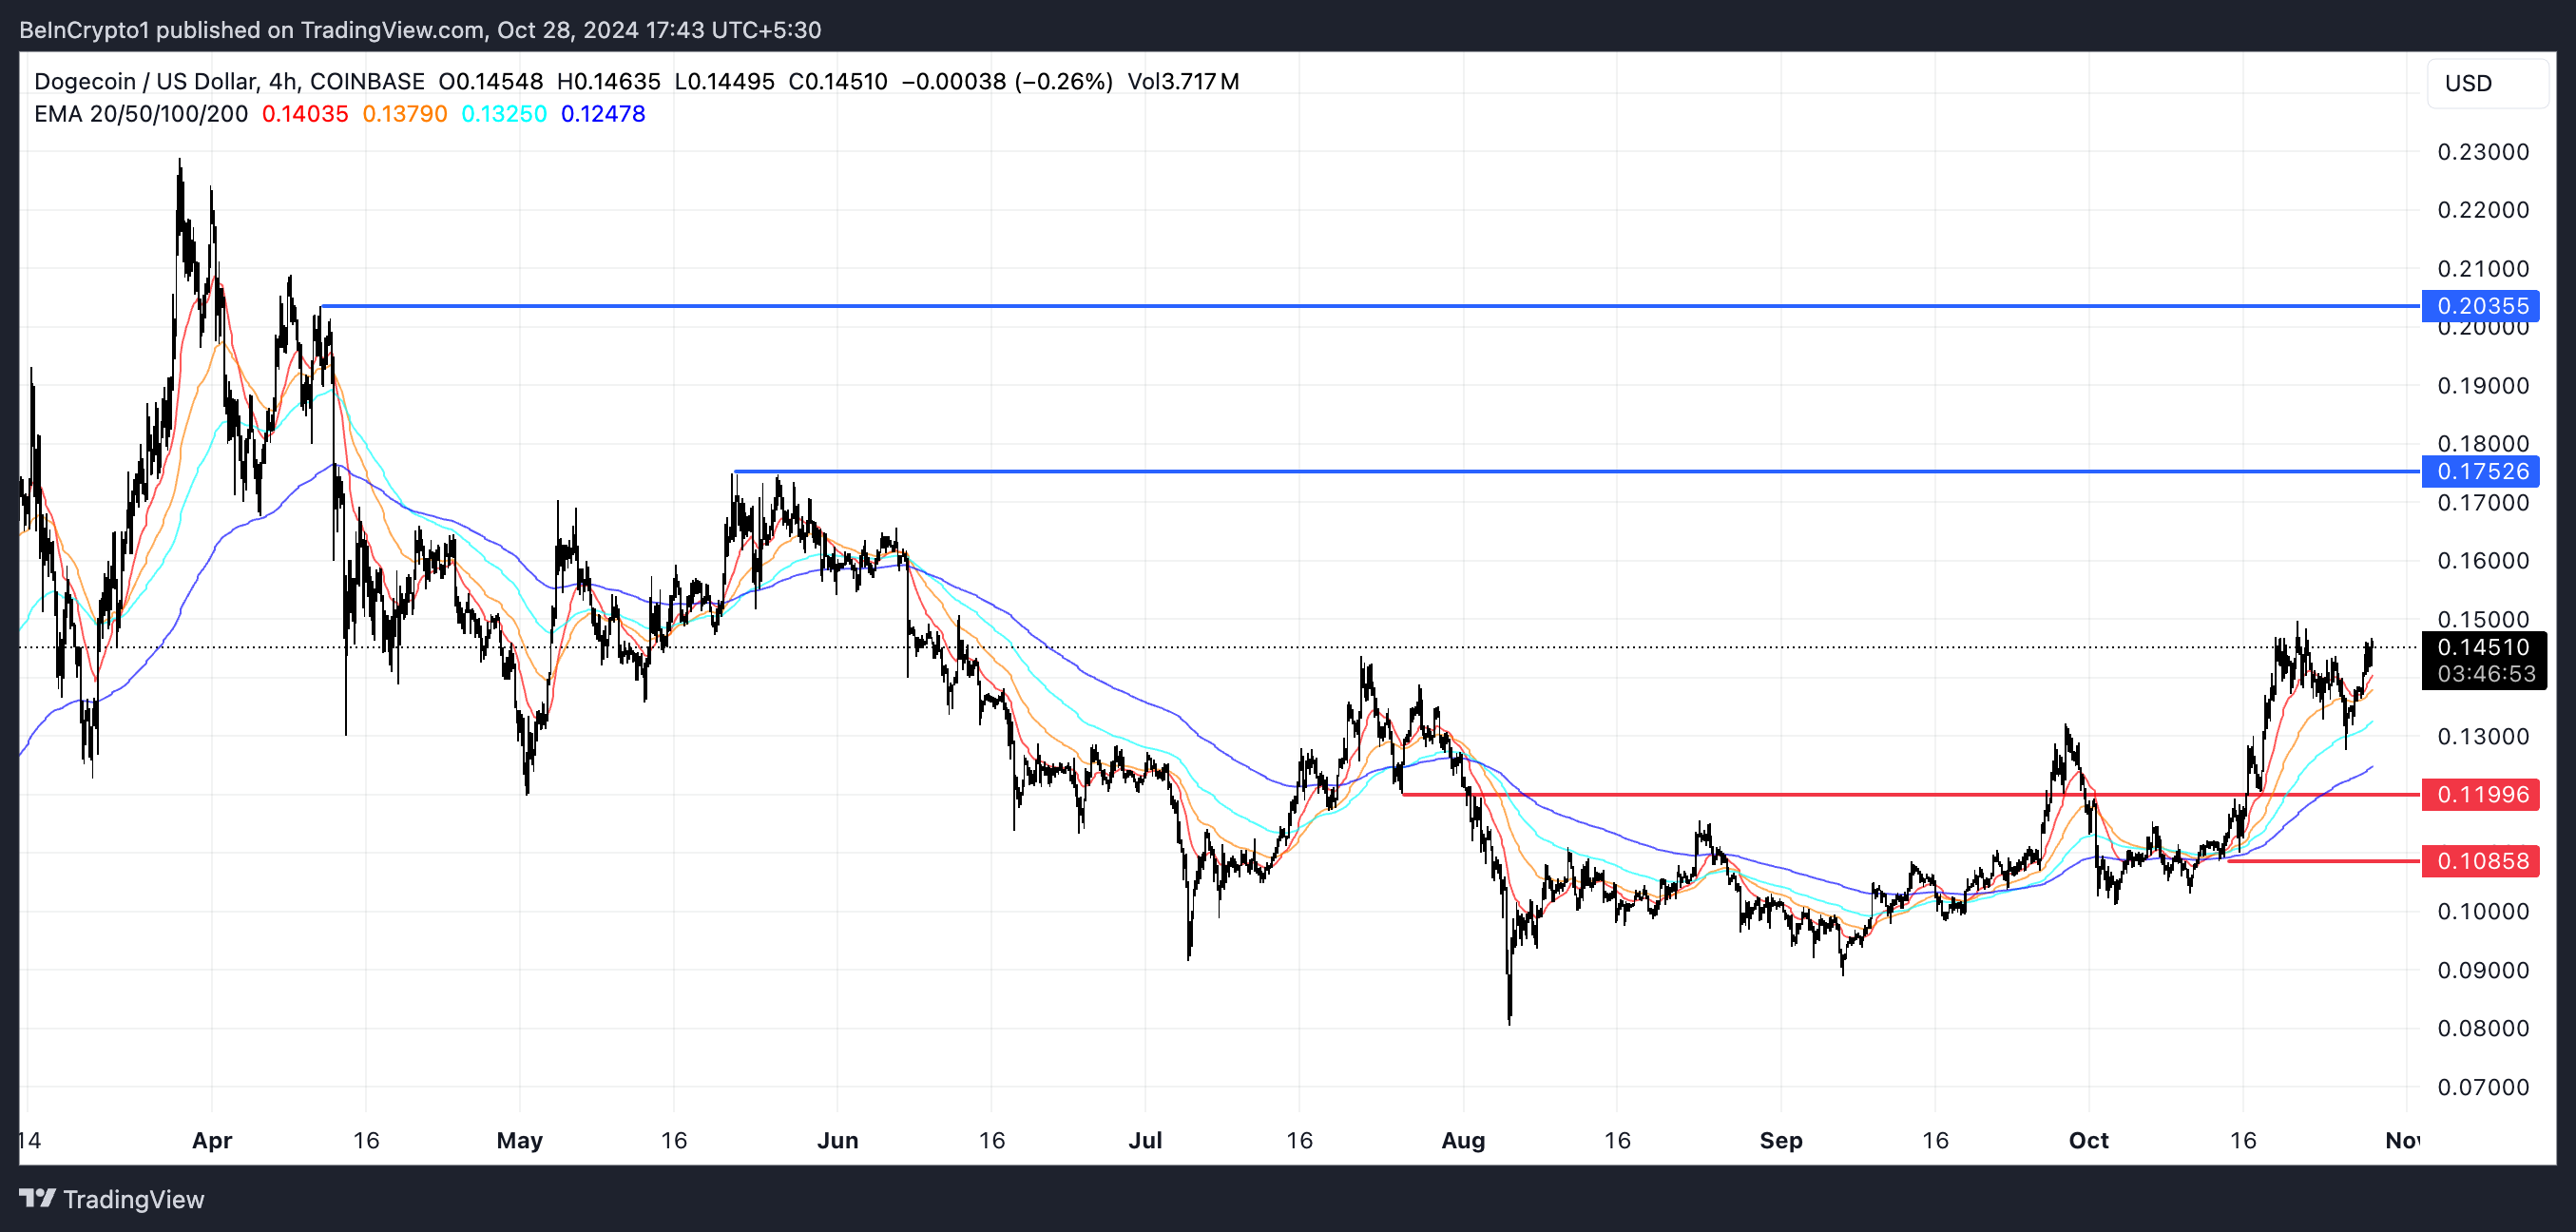
On the upside, key resistance levels are at $0.17526 and $0.20355, highlighted by the blue lines. If the uptrend continues and DOGE can rise to $0.175, this would mean a potential 20% price growth. A rise until $0.20355 would mean the biggest price for DOGE since April.
Breaking above these resistance levels would likely indicate a continuation of the bullish trend, while a failure to do so could result in a pullback to test the support zones.
免責聲明:投資有風險,本文並非投資建議,以上內容不應被視為任何金融產品的購買或出售要約、建議或邀請,作者或其他用戶的任何相關討論、評論或帖子也不應被視為此類內容。本文僅供一般參考,不考慮您的個人投資目標、財務狀況或需求。TTM對信息的準確性和完整性不承擔任何責任或保證,投資者應自行研究並在投資前尋求專業建議。
熱議股票
- 1
- 2
- 3
- 4
- 5
- 6
- 7
- 8
- 9
- 10