Aptos (APT) Secures Support Zone, Signaling Potential Growth
- APT shows moderate trend with mixed signals, reflecting slight buyer advantage but unclear strength.
- Key resistance at $10.77, $11.00; potential growth to $11.22 if trend strengthens, or 21% correction possible.
- Ichimoku and EMA indicators hint at bullish momentum, though a decisive breakout is yet unconfirmed.
The Aptos (APT) price currently reflects a moderate trend, with mixed signals suggesting both potential growth and caution. Recent technical indicators show that while buying pressure slightly outweighs selling, the strength of the trend is not yet firmly established.
APT is positioned near key levels, with buyers and sellers vying for control, which could influence its next major move. This setup leaves APT at a pivotal point, where a shift in momentum could either push it upward or trigger further corrections.
Aptos Current Trend is Moderate
The APT DMI chart shows the ADX at 25, signaling a moderate trend. ADX, or the Average Directional Index, measures the strength of a trend without indicating its direction. When ADX is at 25, it suggests that a trend is present but lacks high strength.
This level is often considered a threshold where the trend starts to become noticeable. However, to reach a strong trend confirmation, ADX would need to rise above 30. At 25, the APT current trend is established but not strong.
Read more: Aptos Crypto (APT): A Guide to What it Is and How it Works
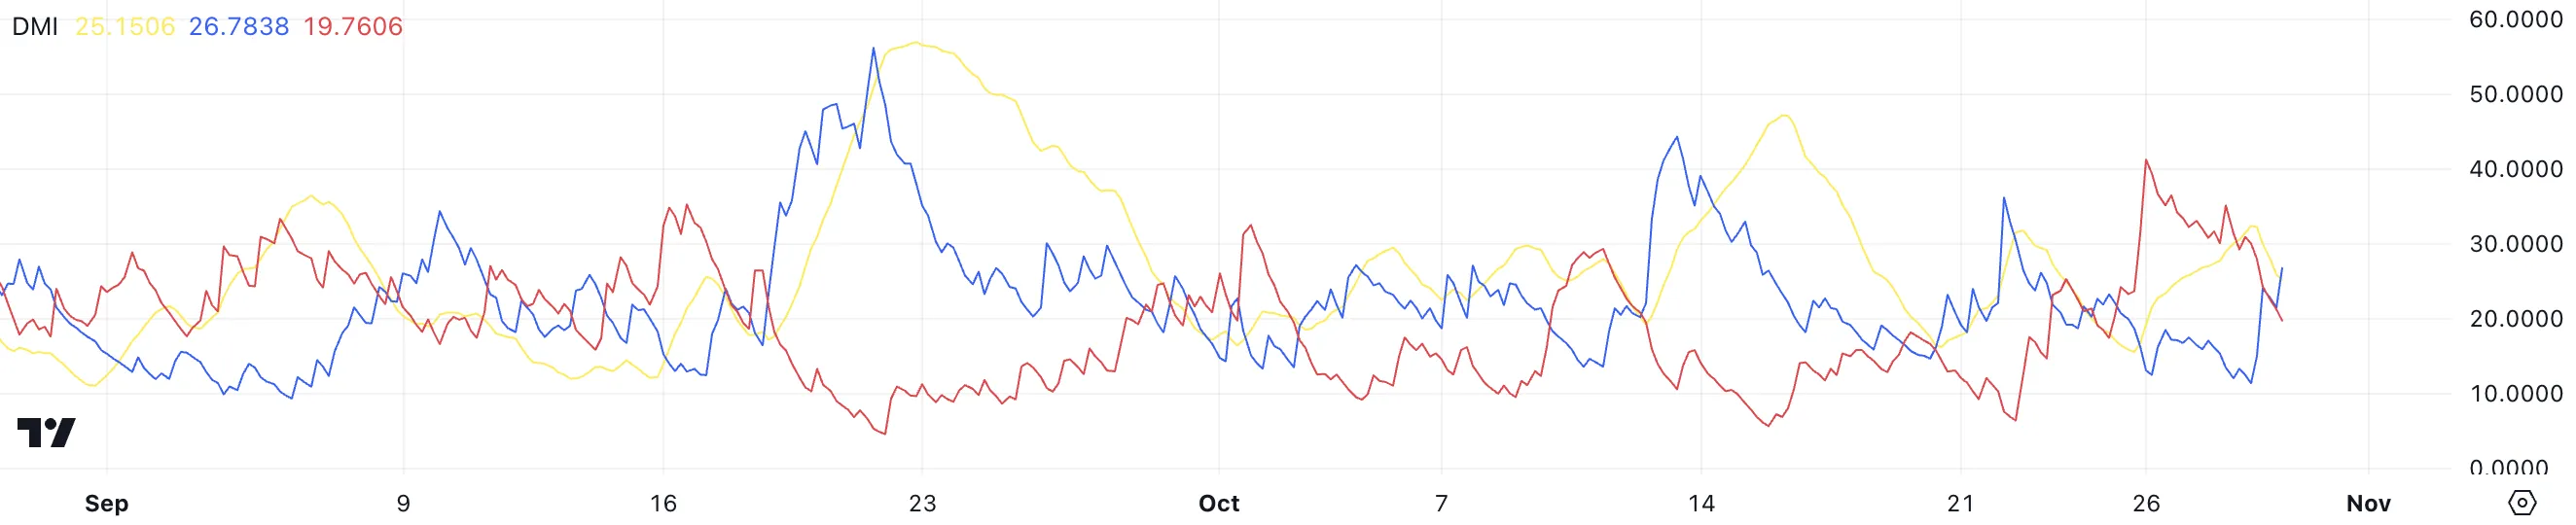
For APT, D+ is at 26.7, and D- is at 19.7, meaning buying pressure is slightly stronger than selling pressure. With D+ above D-, bullish momentum has the upper hand, albeit modestly. This suggests that APT could continue its upward trend if the ADX strengthens further.
APT Ichimoku Cloud Shows a Bullish Setup
The Ichimoku Cloud chart for APT shows the price moving around the cloud area, indicating mixed signals regarding trend direction. The cloud (Kumo) acts as a zone of support and resistance.
When the price is within the cloud, it suggests indecision in the market, with neither bulls nor bears holding a strong advantage. In this chart, APT’s price recently crossed into the cloud after previously dipping below it, signaling a potential trend reversal if it manages to break above and stay above the cloud.
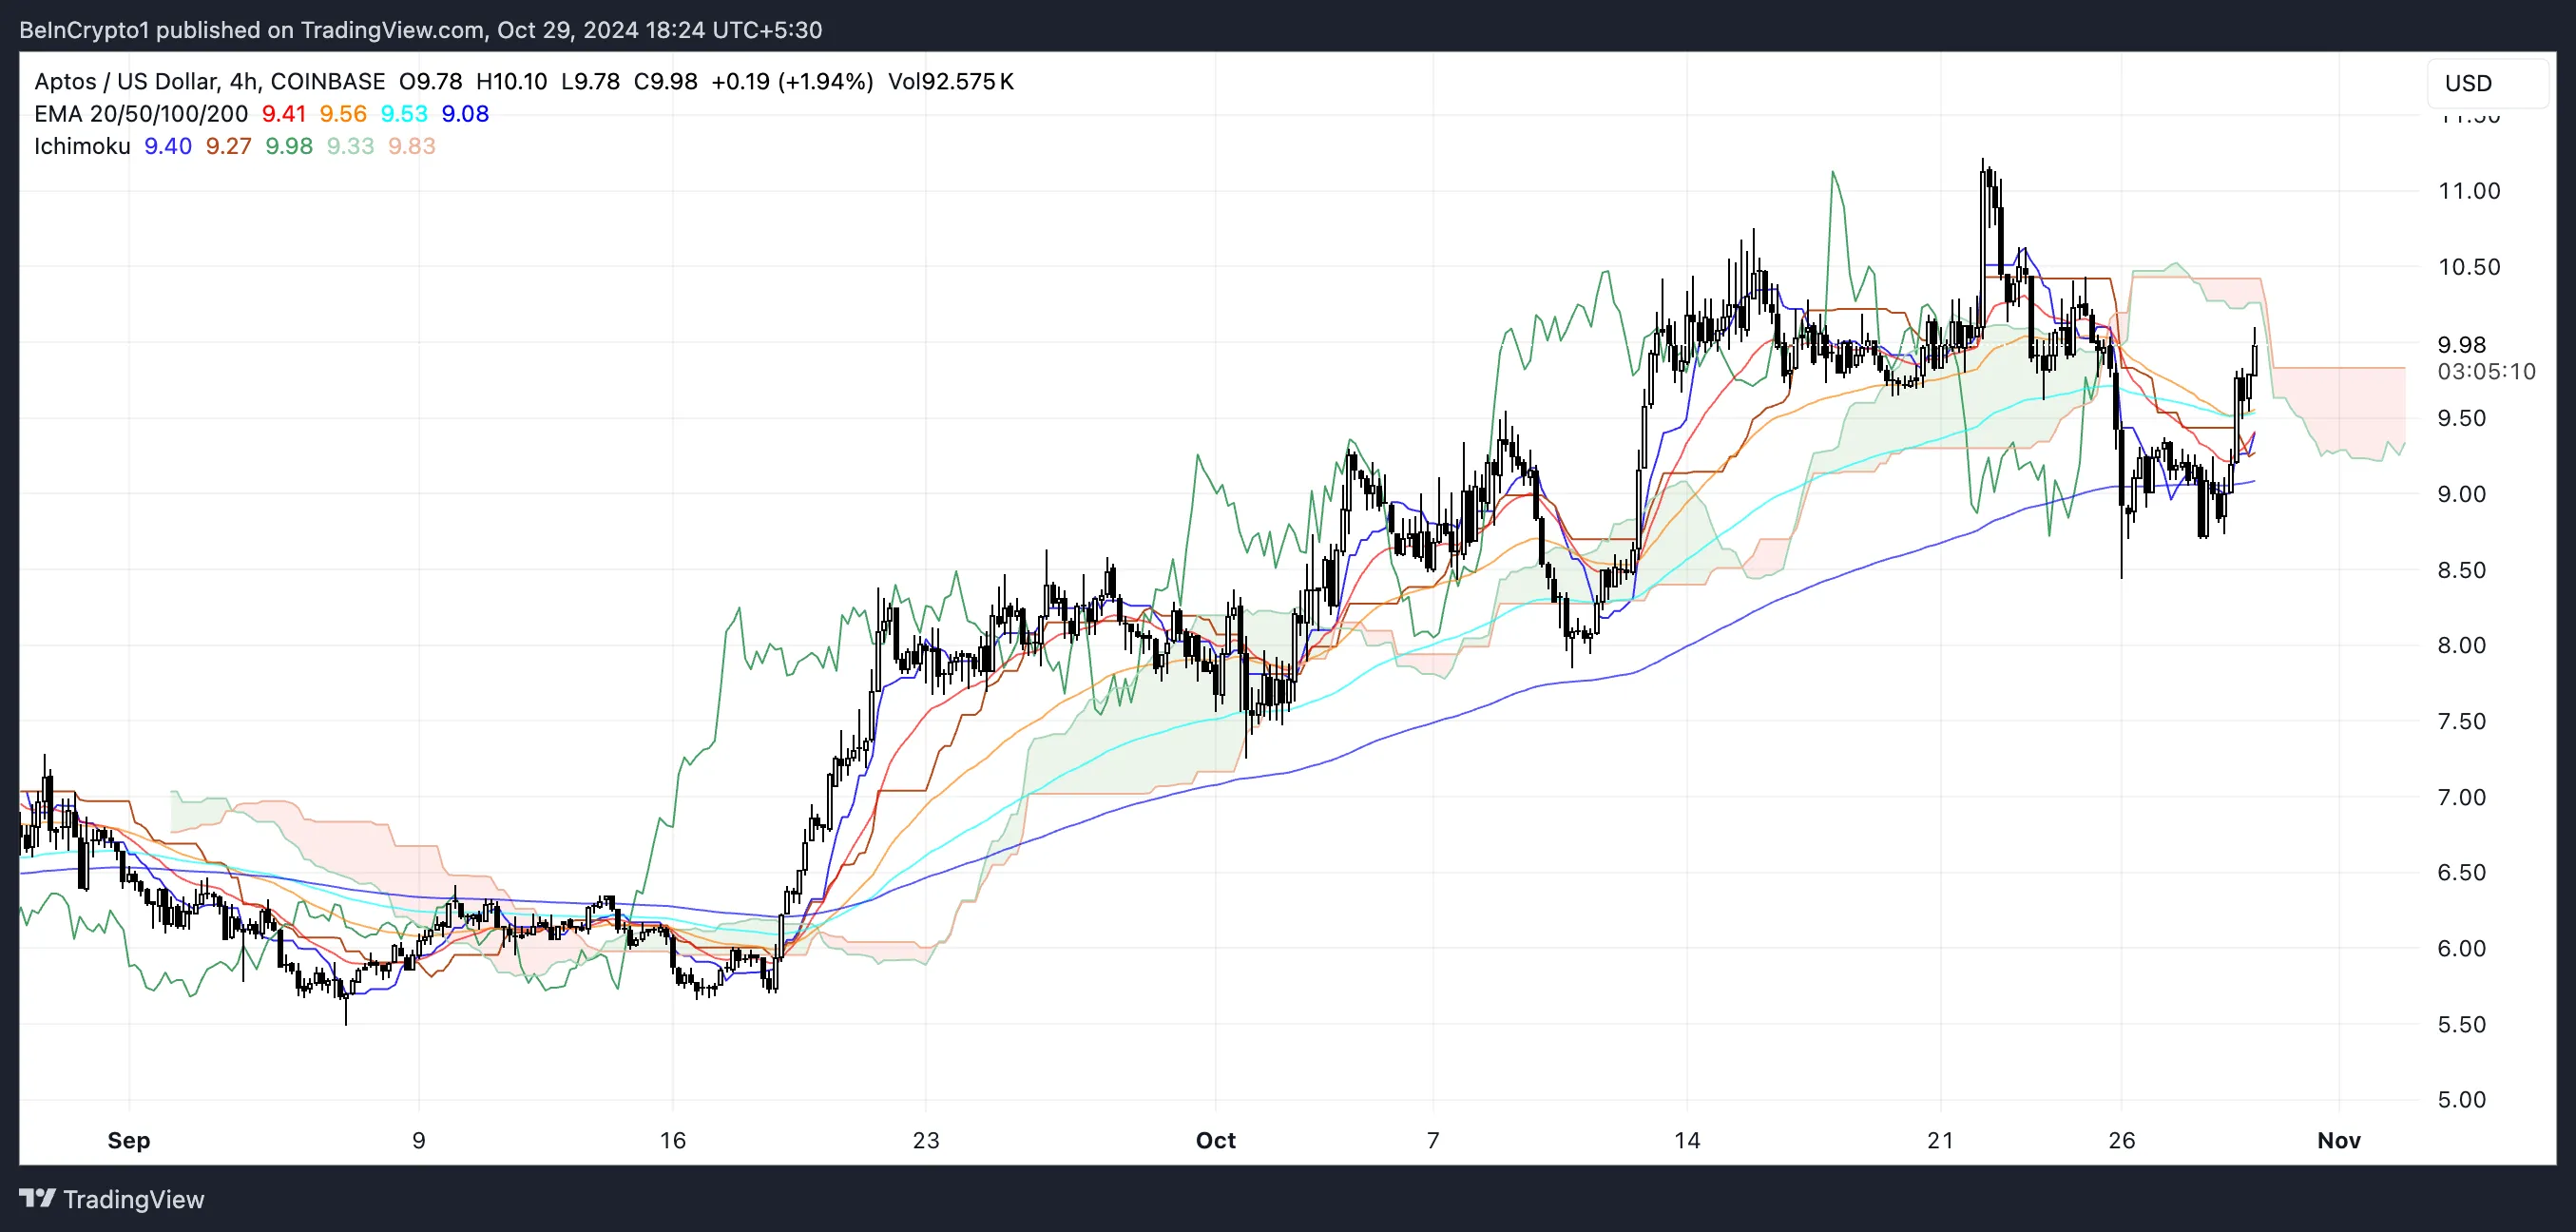
The various lines on the Ichimoku chart offer more insights. The blue line (Tenkan-sen) is now above the red line (Kijun-sen), which suggests short-term bullish momentum.
Additionally, the green cloud ahead appears thin, meaning less resistance if the price rises further. A breakout above the cloud would confirm a bullish trend, while a move below would reinforce bearish momentum.
Aptos Price Prediction: Is APT Price Set to Reach $11 Next?
The EMA lines in the APT price chart show they are well-aligned in ascending order, with shorter EMAs above longer ones, suggesting a generally bullish trend.
The recent bounce above the shorter EMAs hints at bullish momentum. However, if the price fails to break above the resistance zones, it may re-test the support levels, where the lower EMAs would act as dynamic support, reinforcing the trend structure.
Read more: Where To Buy Aptos (APT): 5 Best Platforms for 2024
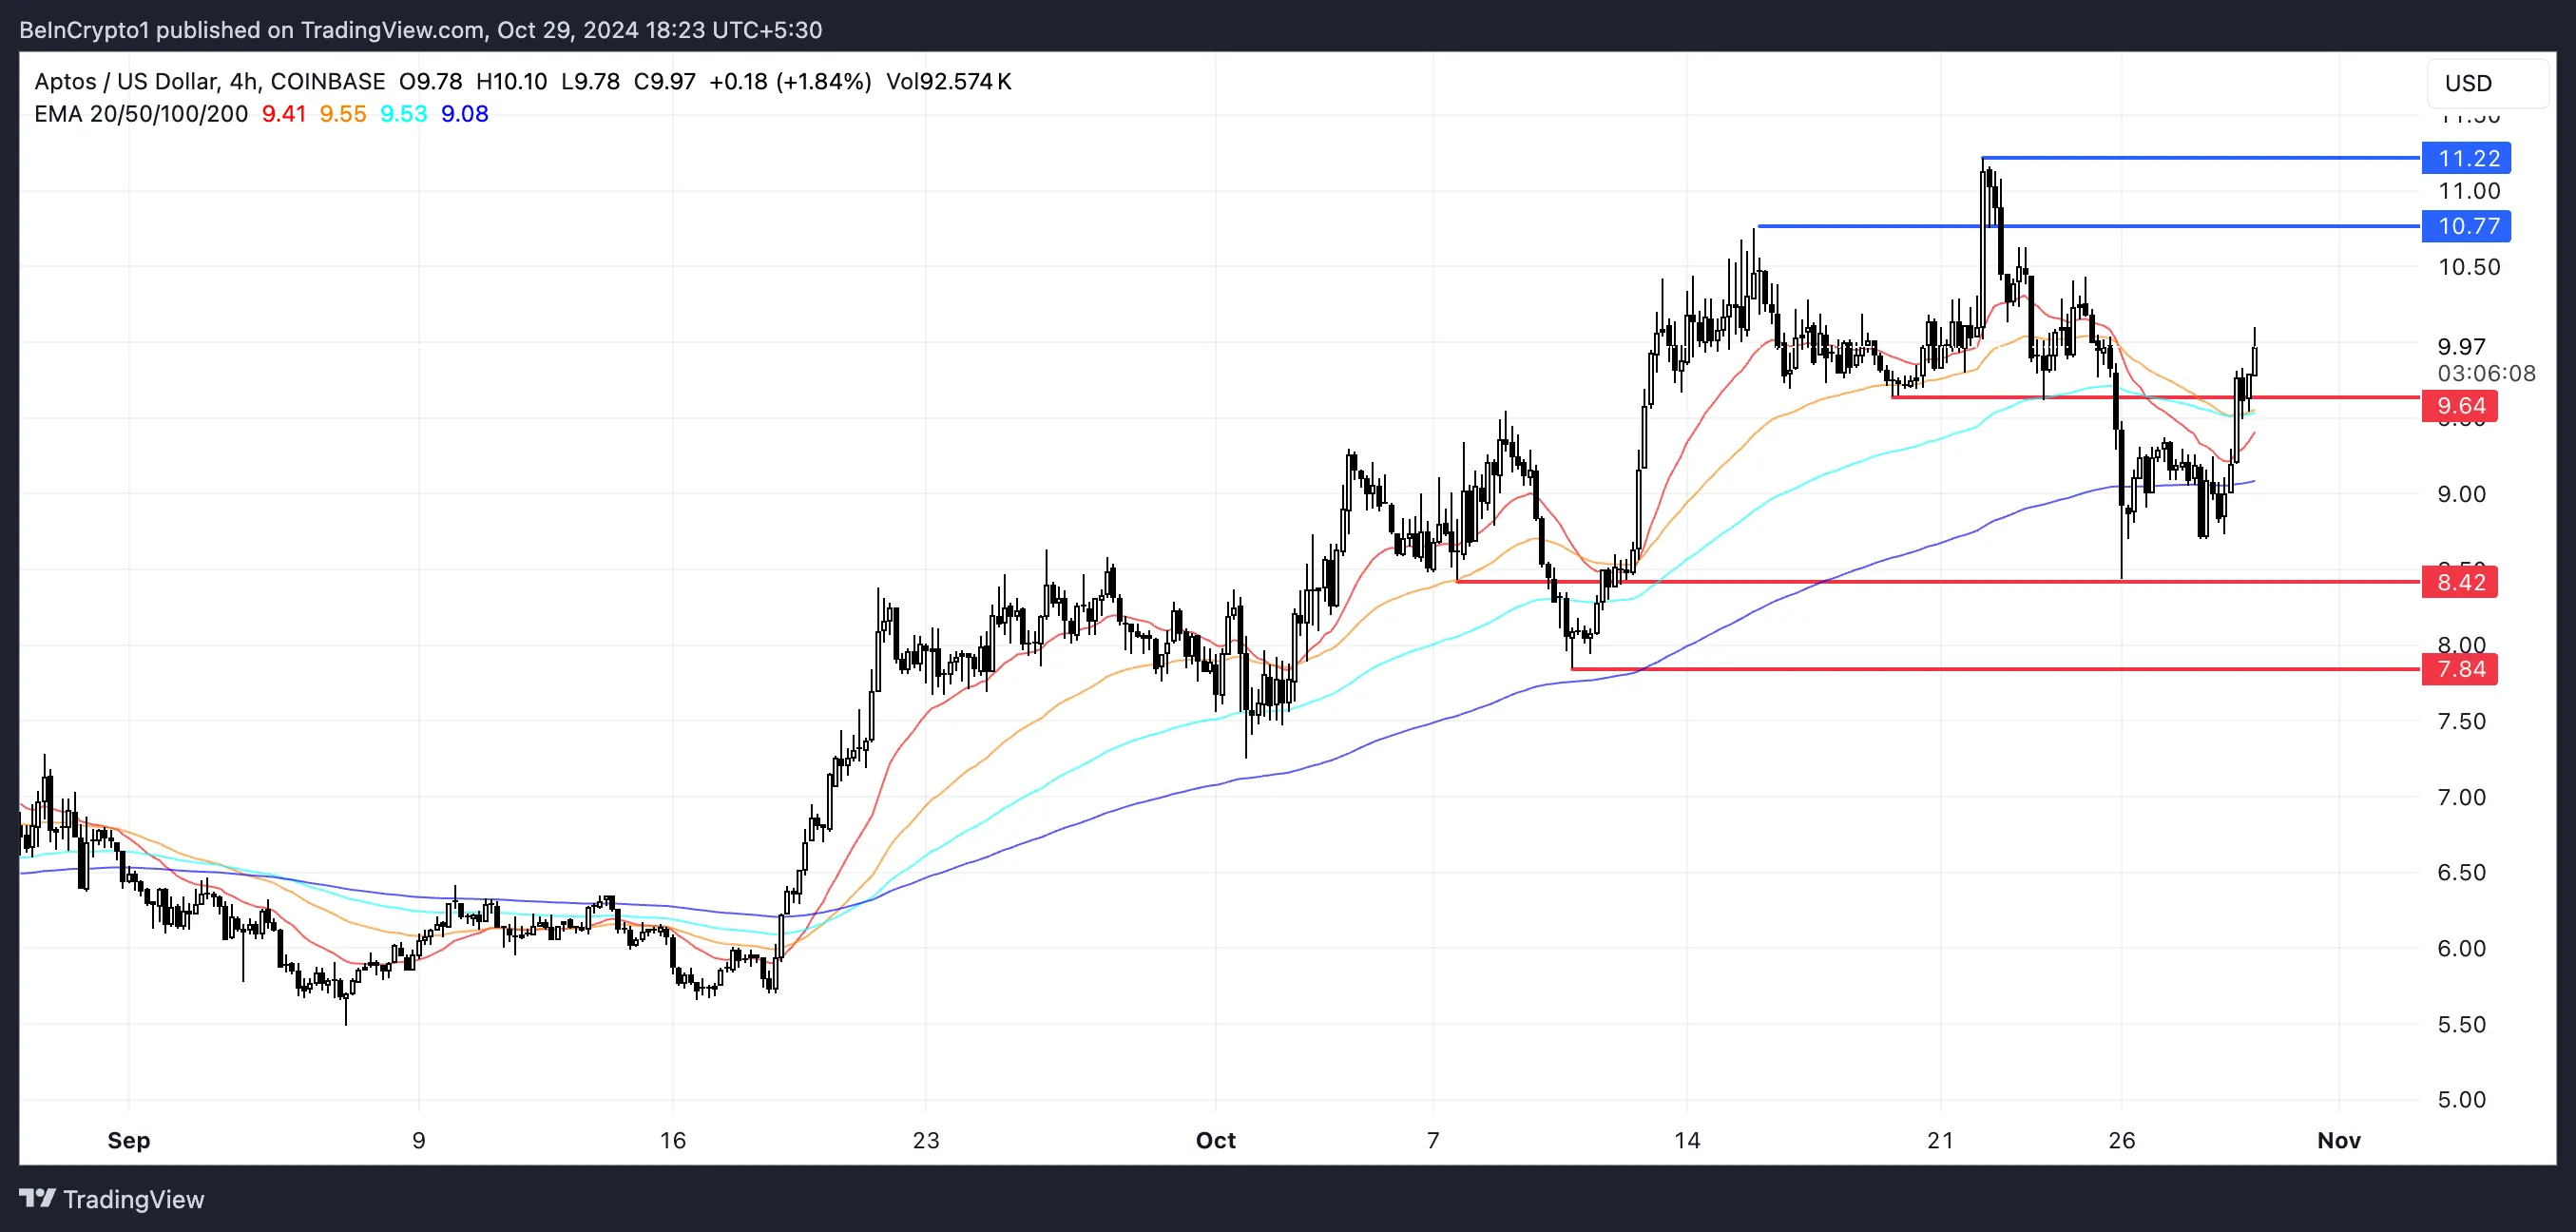
APT currently shows immediate resistance levels around $10.77 and $11.00. However, if the uptrend continues and gets stronger, APT price could rise to $11.22, a potential 12,5% growth.
On the downside, the support levels are at $9.64, $8.42, and $7.84. If APT goes as down as $7.84, that would mean a potential 21% correction.
免責聲明:投資有風險,本文並非投資建議,以上內容不應被視為任何金融產品的購買或出售要約、建議或邀請,作者或其他用戶的任何相關討論、評論或帖子也不應被視為此類內容。本文僅供一般參考,不考慮您的個人投資目標、財務狀況或需求。TTM對信息的準確性和完整性不承擔任何責任或保證,投資者應自行研究並在投資前尋求專業建議。
熱議股票
- 1
- 2
- 3
- 4
- 5
- 6
- 7
- 8
- 9
- 10