The Market Lifts West African Resources Limited (ASX:WAF) Shares 28% But It Can Do More
West African Resources Limited (ASX:WAF) shares have continued their recent momentum with a 28% gain in the last month alone. The last month tops off a massive increase of 108% in the last year.
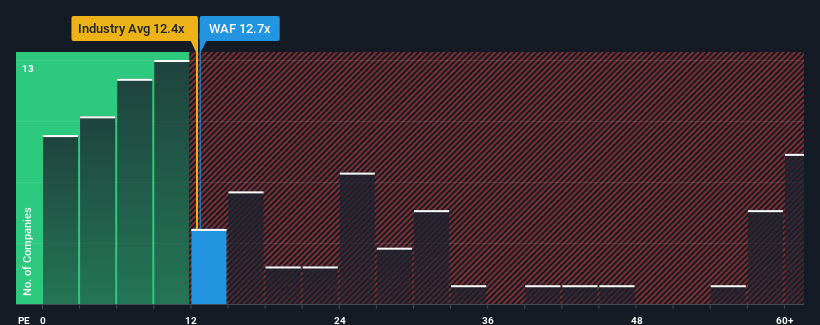
Although its price has surged higher, West African Resources' price-to-earnings (or "P/E") ratio of 12.7x might still make it look like a buy right now compared to the market in Australia, where around half of the companies have P/E ratios above 20x and even P/E's above 36x are quite common. Nonetheless, we'd need to dig a little deeper to determine if there is a rational basis for the reduced P/E.
There hasn't been much to differentiate West African Resources' and the market's earnings growth lately. It might be that many expect the mediocre earnings performance to degrade, which has repressed the P/E. If not, then existing shareholders have reason to be optimistic about the future direction of the share price.
View our latest analysis for West African Resources
Is There Any Growth For West African Resources?
West African Resources' P/E ratio would be typical for a company that's only expected to deliver limited growth, and importantly, perform worse than the market.
Retrospectively, the last year delivered a decent 7.0% gain to the company's bottom line. However, this wasn't enough as the latest three year period has seen an unpleasant 21% overall drop in EPS. Accordingly, shareholders would have felt downbeat about the medium-term rates of earnings growth.
Turning to the outlook, the next three years should generate growth of 48% each year as estimated by the three analysts watching the company. That's shaping up to be materially higher than the 19% per annum growth forecast for the broader market.
With this information, we find it odd that West African Resources is trading at a P/E lower than the market. Apparently some shareholders are doubtful of the forecasts and have been accepting significantly lower selling prices.
What We Can Learn From West African Resources' P/E?
Despite West African Resources' shares building up a head of steam, its P/E still lags most other companies. Typically, we'd caution against reading too much into price-to-earnings ratios when settling on investment decisions, though it can reveal plenty about what other market participants think about the company.
We've established that West African Resources currently trades on a much lower than expected P/E since its forecast growth is higher than the wider market. There could be some major unobserved threats to earnings preventing the P/E ratio from matching the positive outlook. It appears many are indeed anticipating earnings instability, because these conditions should normally provide a boost to the share price.
You should always think about risks. Case in point, we've spotted 3 warning signs for West African Resources you should be aware of, and 1 of them is potentially serious.
It's important to make sure you look for a great company, not just the first idea you come across. So take a peek at this free list of interesting companies with strong recent earnings growth (and a low P/E).
Valuation is complex, but we're here to simplify it.
Discover if West African Resources might be undervalued or overvalued with our detailed analysis, featuring fair value estimates, potential risks, dividends, insider trades, and its financial condition.
Access Free AnalysisHave feedback on this article? Concerned about the content? Get in touch with us directly. Alternatively, email editorial-team (at) simplywallst.com.This article by Simply Wall St is general in nature. We provide commentary based on historical data and analyst forecasts only using an unbiased methodology and our articles are not intended to be financial advice. It does not constitute a recommendation to buy or sell any stock, and does not take account of your objectives, or your financial situation. We aim to bring you long-term focused analysis driven by fundamental data. Note that our analysis may not factor in the latest price-sensitive company announcements or qualitative material. Simply Wall St has no position in any stocks mentioned.
免責聲明:投資有風險,本文並非投資建議,以上內容不應被視為任何金融產品的購買或出售要約、建議或邀請,作者或其他用戶的任何相關討論、評論或帖子也不應被視為此類內容。本文僅供一般參考,不考慮您的個人投資目標、財務狀況或需求。TTM對信息的準確性和完整性不承擔任何責任或保證,投資者應自行研究並在投資前尋求專業建議。
熱議股票
- 1
- 2
- 3
- 4
- 5
- 6
- 7
- 8
- 9
- 10