Sunpower Group Ltd. (SGX:5GD) Top Key Executive Hong Xin Guo, the company's largest shareholder sees 11%reduction in holdings value
Key Insights
- Sunpower Group's significant insider ownership suggests inherent interests in company's expansion
- The top 4 shareholders own 60% of the company
- Using data from company's past performance alongside ownership research, one can better assess the future performance of a company
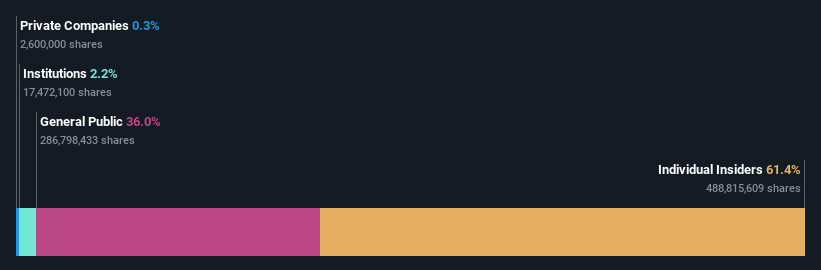
If you want to know who really controls Sunpower Group Ltd. (SGX:5GD), then you'll have to look at the makeup of its share registry. We can see that individual insiders own the lion's share in the company with 61% ownership. In other words, the group stands to gain the most (or lose the most) from their investment into the company.
As a result, insiders as a group endured the highest losses after market cap fell by S$28m.
In the chart below, we zoom in on the different ownership groups of Sunpower Group.
Check out our latest analysis for Sunpower Group
What Does The Institutional Ownership Tell Us About Sunpower Group?
Many institutions measure their performance against an index that approximates the local market. So they usually pay more attention to companies that are included in major indices.
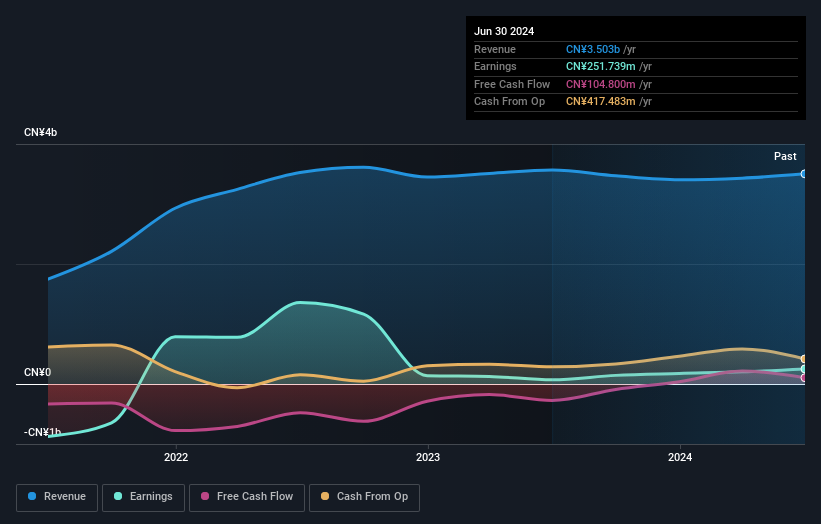
Institutions have a very small stake in Sunpower Group. That indicates that the company is on the radar of some funds, but it isn't particularly popular with professional investors at the moment. If the company is growing earnings, that may indicate that it is just beginning to catch the attention of these deep-pocketed investors. We sometimes see a rising share price when a few big institutions want to buy a certain stock at the same time. The history of earnings and revenue, which you can see below, could be helpful in considering if more institutional investors will want the stock. Of course, there are plenty of other factors to consider, too.
Sunpower Group is not owned by hedge funds. Our data suggests that Hong Xin Guo, who is also the company's Top Key Executive, holds the most number of shares at 19%. When an insider holds a sizeable amount of a company's stock, investors consider it as a positive sign because it suggests that insiders are willing to have their wealth tied up in the future of the company. With 17% and 13% of the shares outstanding respectively, Ming Ma and Yucheng Lin are the second and third largest shareholders. Interestingly, the second-largest shareholder, Ming Ma is also Chief Executive Officer, again, pointing towards strong insider ownership amongst the company's top shareholders.
Our research also brought to light the fact that roughly 60% of the company is controlled by the top 4 shareholders suggesting that these owners wield significant influence on the business.
While studying institutional ownership for a company can add value to your research, it is also a good practice to research analyst recommendations to get a deeper understand of a stock's expected performance. As far as we can tell there isn't analyst coverage of the company, so it is probably flying under the radar.
Insider Ownership Of Sunpower Group
The definition of company insiders can be subjective and does vary between jurisdictions. Our data reflects individual insiders, capturing board members at the very least. Company management run the business, but the CEO will answer to the board, even if he or she is a member of it.
Insider ownership is positive when it signals leadership are thinking like the true owners of the company. However, high insider ownership can also give immense power to a small group within the company. This can be negative in some circumstances.
Our most recent data indicates that insiders own the majority of Sunpower Group Ltd.. This means they can collectively make decisions for the company. Given it has a market cap of S$231m, that means they have S$142m worth of shares. It is good to see this level of investment. You can check here to see if those insiders have been buying recently.
General Public Ownership
The general public-- including retail investors -- own 36% stake in the company, and hence can't easily be ignored. While this group can't necessarily call the shots, it can certainly have a real influence on how the company is run.
Next Steps:
It's always worth thinking about the different groups who own shares in a company. But to understand Sunpower Group better, we need to consider many other factors. Case in point: We've spotted 2 warning signs for Sunpower Group you should be aware of, and 1 of them is significant.
Of course this may not be the best stock to buy. Therefore, you may wish to see our free collection of interesting prospects boasting favorable financials.
NB: Figures in this article are calculated using data from the last twelve months, which refer to the 12-month period ending on the last date of the month the financial statement is dated. This may not be consistent with full year annual report figures.
New: Manage All Your Stock Portfolios in One Place
We've created the ultimate portfolio companion for stock investors, and it's free.
• Connect an unlimited number of Portfolios and see your total in one currency• Be alerted to new Warning Signs or Risks via email or mobile• Track the Fair Value of your stocks
Try a Demo Portfolio for FreeHave feedback on this article? Concerned about the content? Get in touch with us directly. Alternatively, email editorial-team (at) simplywallst.com.This article by Simply Wall St is general in nature. We provide commentary based on historical data and analyst forecasts only using an unbiased methodology and our articles are not intended to be financial advice. It does not constitute a recommendation to buy or sell any stock, and does not take account of your objectives, or your financial situation. We aim to bring you long-term focused analysis driven by fundamental data. Note that our analysis may not factor in the latest price-sensitive company announcements or qualitative material. Simply Wall St has no position in any stocks mentioned.
免責聲明:投資有風險,本文並非投資建議,以上內容不應被視為任何金融產品的購買或出售要約、建議或邀請,作者或其他用戶的任何相關討論、評論或帖子也不應被視為此類內容。本文僅供一般參考,不考慮您的個人投資目標、財務狀況或需求。TTM對信息的準確性和完整性不承擔任何責任或保證,投資者應自行研究並在投資前尋求專業建議。
熱議股票
- 1
- 2
- 3
- 4
- 5
- 6
- 7
- 8
- 9
- 10