3 ASX Penny Stocks With Market Caps Over A$6M To Consider
The Australian market has shown resilience, with the ASX200 closing up 0.74% at 8,285 points, buoyed by strong performances in the Utilities and Financials sectors. Despite mixed signals from Chinese economic data, investors are navigating opportunities across various sectors. Penny stocks, though often overlooked as a term from past trading days, still represent viable investment opportunities when backed by solid financials and growth potential. In this article, we explore three penny stocks that stand out for their financial strength and potential to offer significant returns to discerning investors.
Top 10 Penny Stocks In Australia
| Name | Share Price | Market Cap | Financial Health Rating |
| LaserBond (ASX:LBL) | A$0.6025 | A$70.63M | ★★★★★★ |
| Embark Early Education (ASX:EVO) | A$0.80 | A$146.79M | ★★★★☆☆ |
| Helloworld Travel (ASX:HLO) | A$2.04 | A$332.15M | ★★★★★★ |
| Austin Engineering (ASX:ANG) | A$0.545 | A$337.98M | ★★★★★☆ |
| MaxiPARTS (ASX:MXI) | A$1.89 | A$104.55M | ★★★★★★ |
| SHAPE Australia (ASX:SHA) | A$2.75 | A$228.01M | ★★★★★★ |
| Navigator Global Investments (ASX:NGI) | A$1.685 | A$825.78M | ★★★★★☆ |
| West African Resources (ASX:WAF) | A$1.445 | A$1.65B | ★★★★★★ |
| Atlas Pearls (ASX:ATP) | A$0.155 | A$67.53M | ★★★★★★ |
| Servcorp (ASX:SRV) | A$4.93 | A$486.42M | ★★★★☆☆ |
Click here to see the full list of 1,039 stocks from our ASX Penny Stocks screener.
Let's explore several standout options from the results in the screener.
Aerometrex (ASX:AMX)
Simply Wall St Financial Health Rating: ★★★★★☆
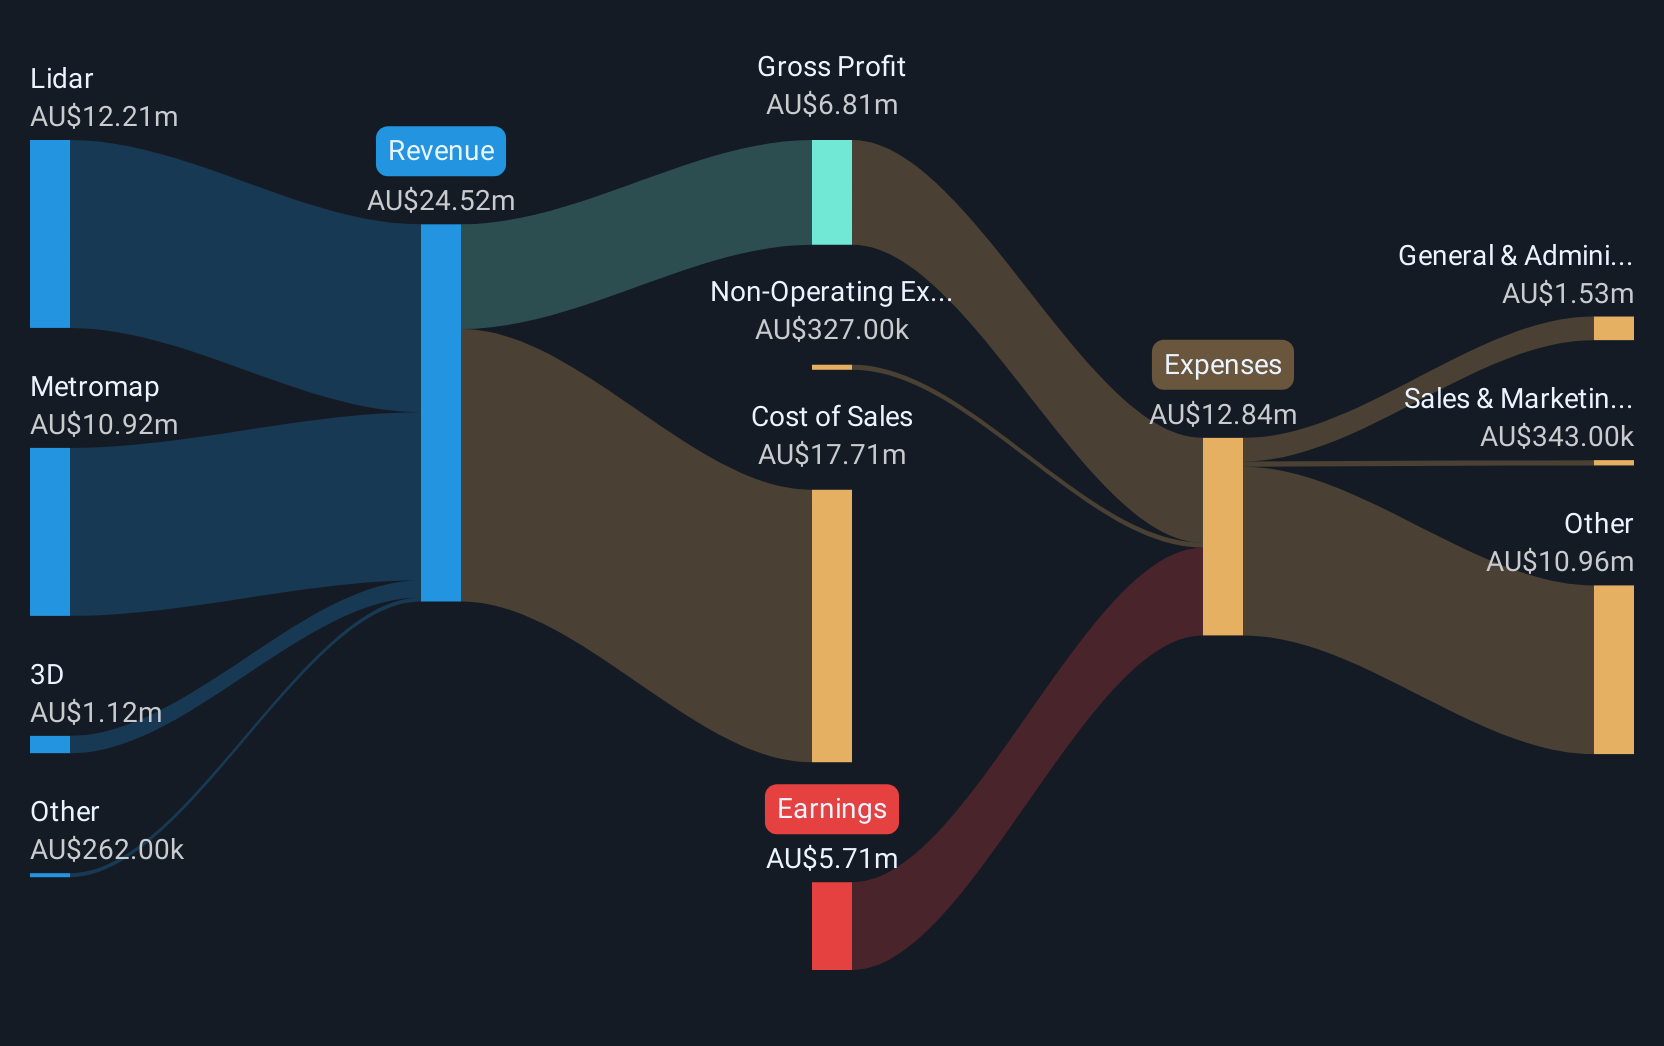
Overview: Aerometrex Limited, with a market cap of A$28.46 million, operates in the aerial mapping industry in Australia and the United States through its subsidiaries.
Operations: The company's revenue is derived from three segments: 3D services generating A$0.86 million, Lidar contributing A$14.15 million, and Metromap bringing in A$9.74 million.
Market Cap: A$28.46M
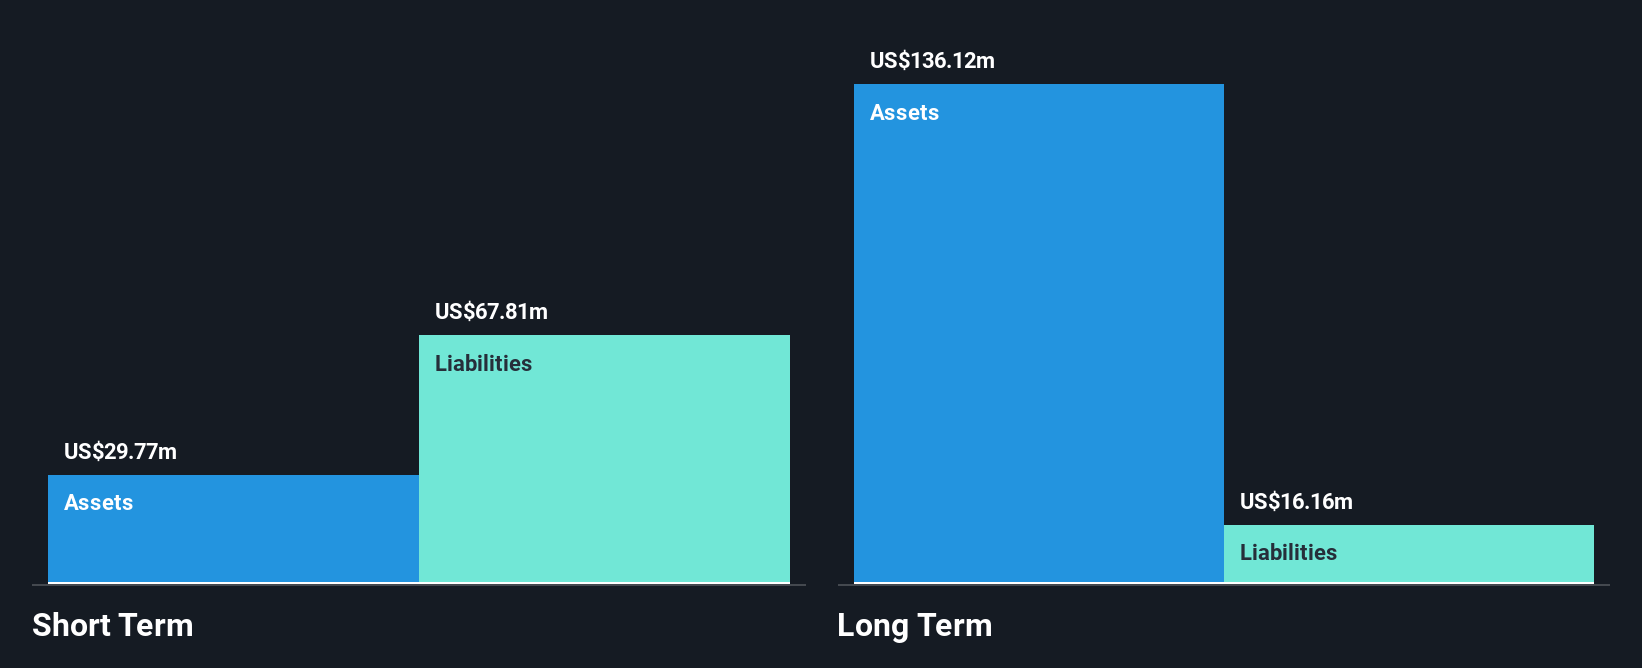
Aerometrex Limited, with a market cap of A$28.46 million, operates in the aerial mapping industry and is currently unprofitable. Despite its revenue of A$24.76 million for the year ending June 2024, earnings have declined significantly over the past five years at a rate of 40.5% per year. The company has sufficient cash runway for more than three years and has reduced its debt-to-equity ratio from 169.3% to 11.5% over five years, indicating improved financial stability. However, losses increased to A$4.67 million compared to A$4.24 million last year, highlighting ongoing profitability challenges.
- Take a closer look at Aerometrex's potential here in our financial health report.
- Explore historical data to track Aerometrex's performance over time in our past results report.
Catapult Group International (ASX:CAT)
Simply Wall St Financial Health Rating: ★★★★☆☆
Overview: Catapult Group International Ltd is a sports science and analytics company that offers technologies to enhance athlete performance, prevent injuries, and aid recovery across various regions including Australia, Europe, the Middle East, Africa, the Asia Pacific, and the Americas with a market cap of A$778.75 million.
Operations: No specific revenue segments are reported for Catapult Group International Ltd.
Market Cap: A$778.75M
Catapult Group International, with a market cap of A$778.75 million, recently reported half-year sales of US$57.84 million, up from US$49.76 million the previous year, while its net loss narrowed to US$7.45 million from US$8.39 million. Despite being unprofitable and not expected to achieve profitability in the next three years, Catapult maintains a strong cash position exceeding its total debt and has a cash runway for more than three years if it continues positive free cash flow trends. However, shareholders have experienced dilution over the past year alongside significant insider selling in recent months.
- Jump into the full analysis health report here for a deeper understanding of Catapult Group International.
- Review our growth performance report to gain insights into Catapult Group International's future.
Rubix Resources (ASX:RB6)
Simply Wall St Financial Health Rating: ★★★★★★
Overview: Rubix Resources Limited focuses on acquiring, exploring, and evaluating mineral resource projects and has a market cap of A$6.76 million.
Operations: Rubix Resources Limited currently does not report any revenue segments.
Market Cap: A$6.76M
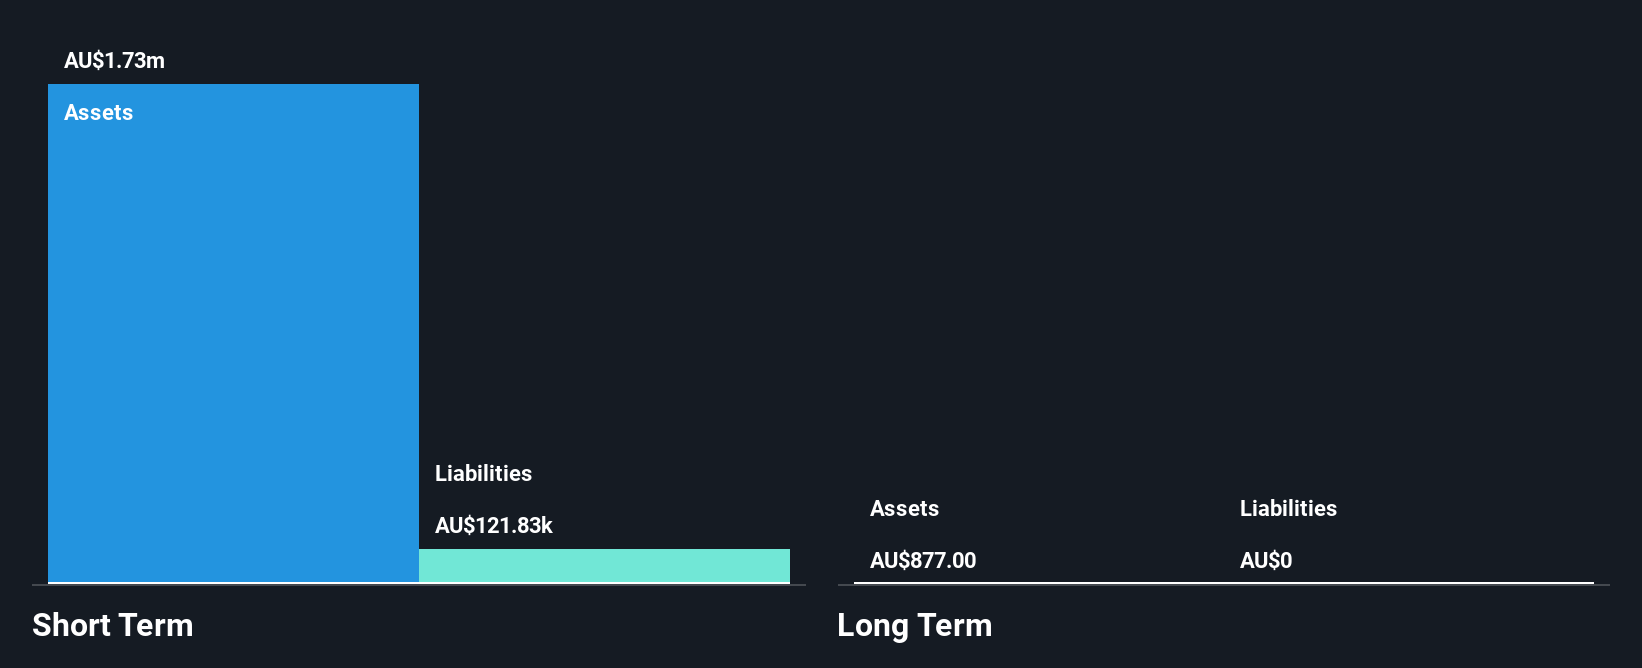
Rubix Resources Limited, with a market cap of A$6.76 million, is pre-revenue and currently unprofitable, reporting a net loss of A$5.45 million for the year ending June 2024. The company benefits from having no debt and its short-term assets exceeding liabilities by a significant margin. It has an experienced board with an average tenure of 3.7 years and maintains stability in weekly volatility at 12%. Rubix has over a year's cash runway based on current free cash flow trends but faces challenges as it continues to operate without meaningful revenue streams or profit growth acceleration.
- Click to explore a detailed breakdown of our findings in Rubix Resources' financial health report.
- Assess Rubix Resources' previous results with our detailed historical performance reports.
Turning Ideas Into Actions
- Access the full spectrum of 1,039 ASX Penny Stocks by clicking on this link.
- Are you invested in these stocks already? Keep abreast of every twist and turn by setting up a portfolio with Simply Wall St, where we make it simple for investors like you to stay informed and proactive.
- Discover a world of investment opportunities with Simply Wall St's free app and access unparalleled stock analysis across all markets.
Looking For Alternative Opportunities?
- Explore high-performing small cap companies that haven't yet garnered significant analyst attention.
- Jump on the AI train with fast growing tech companies forging a new era of innovation.
- Find companies with promising cash flow potential yet trading below their fair value.
This article by Simply Wall St is general in nature. We provide commentary based on historical data and analyst forecasts only using an unbiased methodology and our articles are not intended to be financial advice. It does not constitute a recommendation to buy or sell any stock, and does not take account of your objectives, or your financial situation. We aim to bring you long-term focused analysis driven by fundamental data. Note that our analysis may not factor in the latest price-sensitive company announcements or qualitative material. Simply Wall St has no position in any stocks mentioned.
New: AI Stock Screener & Alerts
Our new AI Stock Screener scans the market every day to uncover opportunities.
• Dividend Powerhouses (3%+ Yield)• Undervalued Small Caps with Insider Buying• High growth Tech and AI CompaniesOr build your own from over 50 metrics.
Explore Now for FreeHave feedback on this article? Concerned about the content? Get in touch with us directly. Alternatively, email editorial-team@simplywallst.com
免責聲明:投資有風險,本文並非投資建議,以上內容不應被視為任何金融產品的購買或出售要約、建議或邀請,作者或其他用戶的任何相關討論、評論或帖子也不應被視為此類內容。本文僅供一般參考,不考慮您的個人投資目標、財務狀況或需求。TTM對信息的準確性和完整性不承擔任何責任或保證,投資者應自行研究並在投資前尋求專業建議。
熱議股票
- 1
- 2
- 3
- 4
- 5
- 6
- 7
- 8
- 9
- 10