Universal Display Corporation (NASDAQ:OLED) down to US$8.0b market cap, but institutional owners may not be as affected after a year of 3.3% returns
Key Insights
- Given the large stake in the stock by institutions, Universal Display's stock price might be vulnerable to their trading decisions
- 50% of the business is held by the top 13 shareholders
- Insiders have been selling lately
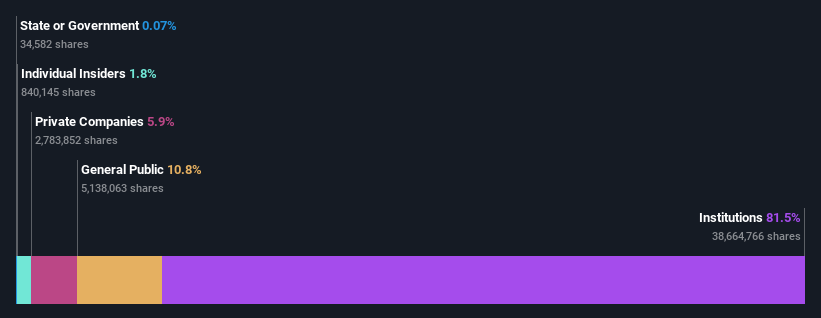
A look at the shareholders of Universal Display Corporation (NASDAQ:OLED) can tell us which group is most powerful. We can see that institutions own the lion's share in the company with 81% ownership. Put another way, the group faces the maximum upside potential (or downside risk).
Institutional investors was the group most impacted after the company's market cap fell to US$8.0b last week. However, the 3.3% one-year returns may have helped alleviate their overall losses. We would assume however, that they would be on the lookout for weakness in the future.
Let's delve deeper into each type of owner of Universal Display, beginning with the chart below.
Check out our latest analysis for Universal Display
What Does The Institutional Ownership Tell Us About Universal Display?
Institutional investors commonly compare their own returns to the returns of a commonly followed index. So they generally do consider buying larger companies that are included in the relevant benchmark index.
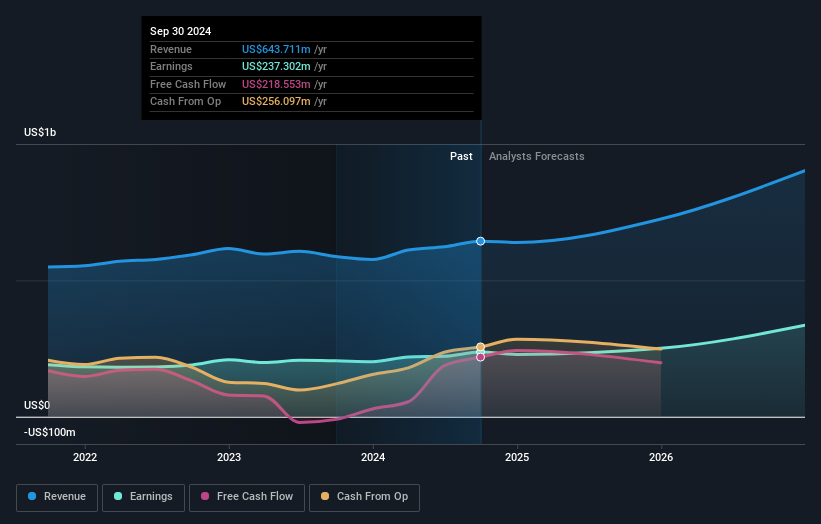
We can see that Universal Display does have institutional investors; and they hold a good portion of the company's stock. This suggests some credibility amongst professional investors. But we can't rely on that fact alone since institutions make bad investments sometimes, just like everyone does. If multiple institutions change their view on a stock at the same time, you could see the share price drop fast. It's therefore worth looking at Universal Display's earnings history below. Of course, the future is what really matters.
Since institutional investors own more than half the issued stock, the board will likely have to pay attention to their preferences. Hedge funds don't have many shares in Universal Display. BlackRock, Inc. is currently the largest shareholder, with 10% of shares outstanding. For context, the second largest shareholder holds about 10% of the shares outstanding, followed by an ownership of 5.6% by the third-largest shareholder.
A closer look at our ownership figures suggests that the top 13 shareholders have a combined ownership of 50% implying that no single shareholder has a majority.
While it makes sense to study institutional ownership data for a company, it also makes sense to study analyst sentiments to know which way the wind is blowing. Quite a few analysts cover the stock, so you could look into forecast growth quite easily.
Insider Ownership Of Universal Display
The definition of company insiders can be subjective and does vary between jurisdictions. Our data reflects individual insiders, capturing board members at the very least. Management ultimately answers to the board. However, it is not uncommon for managers to be executive board members, especially if they are a founder or the CEO.
I generally consider insider ownership to be a good thing. However, on some occasions it makes it more difficult for other shareholders to hold the board accountable for decisions.
We can see that insiders own shares in Universal Display Corporation. It is a pretty big company, so it is generally a positive to see some potentially meaningful alignment. In this case, they own around US$141m worth of shares (at current prices). It is good to see this level of investment by insiders. You can check here to see if those insiders have been buying recently.
General Public Ownership
With a 11% ownership, the general public, mostly comprising of individual investors, have some degree of sway over Universal Display. This size of ownership, while considerable, may not be enough to change company policy if the decision is not in sync with other large shareholders.
Private Company Ownership
It seems that Private Companies own 5.9%, of the Universal Display stock. It might be worth looking deeper into this. If related parties, such as insiders, have an interest in one of these private companies, that should be disclosed in the annual report. Private companies may also have a strategic interest in the company.
Next Steps:
I find it very interesting to look at who exactly owns a company. But to truly gain insight, we need to consider other information, too. Consider risks, for instance. Every company has them, and we've spotted 1 warning sign for Universal Display you should know about.
If you would prefer discover what analysts are predicting in terms of future growth, do not miss this free report on analyst forecasts.
NB: Figures in this article are calculated using data from the last twelve months, which refer to the 12-month period ending on the last date of the month the financial statement is dated. This may not be consistent with full year annual report figures.
New: AI Stock Screener & Alerts
Our new AI Stock Screener scans the market every day to uncover opportunities.
• Dividend Powerhouses (3%+ Yield)• Undervalued Small Caps with Insider Buying• High growth Tech and AI CompaniesOr build your own from over 50 metrics.
Explore Now for FreeHave feedback on this article? Concerned about the content? Get in touch with us directly. Alternatively, email editorial-team (at) simplywallst.com.This article by Simply Wall St is general in nature. We provide commentary based on historical data and analyst forecasts only using an unbiased methodology and our articles are not intended to be financial advice. It does not constitute a recommendation to buy or sell any stock, and does not take account of your objectives, or your financial situation. We aim to bring you long-term focused analysis driven by fundamental data. Note that our analysis may not factor in the latest price-sensitive company announcements or qualitative material. Simply Wall St has no position in any stocks mentioned.
免責聲明:投資有風險,本文並非投資建議,以上內容不應被視為任何金融產品的購買或出售要約、建議或邀請,作者或其他用戶的任何相關討論、評論或帖子也不應被視為此類內容。本文僅供一般參考,不考慮您的個人投資目標、財務狀況或需求。TTM對信息的準確性和完整性不承擔任何責任或保證,投資者應自行研究並在投資前尋求專業建議。
熱議股票
- 1
- 2
- 3
- 4
- 5
- 6
- 7
- 8
- 9
- 10