Revenues Working Against Oliver's Real Food Limited's (ASX:OLI) Share Price Following 31% Dive
Oliver's Real Food Limited (ASX:OLI) shareholders won't be pleased to see that the share price has had a very rough month, dropping 31% and undoing the prior period's positive performance. The recent drop completes a disastrous twelve months for shareholders, who are sitting on a 53% loss during that time.
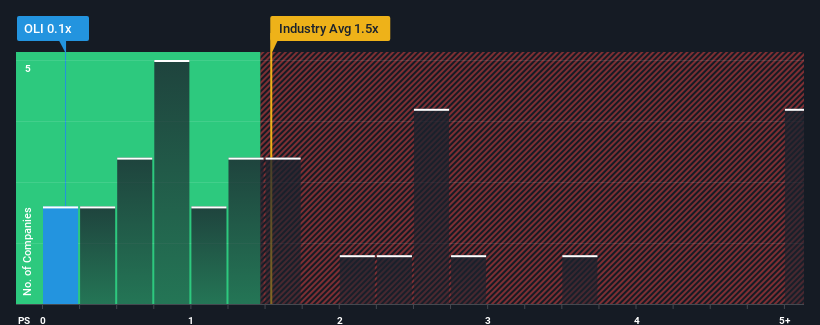
Since its price has dipped substantially, it would be understandable if you think Oliver's Real Food is a stock with good investment prospects with a price-to-sales ratios (or "P/S") of 0.1x, considering almost half the companies in Australia's Hospitality industry have P/S ratios above 1.5x. Nonetheless, we'd need to dig a little deeper to determine if there is a rational basis for the reduced P/S.
View our latest analysis for Oliver's Real Food
What Does Oliver's Real Food's P/S Mean For Shareholders?
The recent revenue growth at Oliver's Real Food would have to be considered satisfactory if not spectacular. Perhaps the market believes the recent revenue performance might fall short of industry figures in the near future, leading to a reduced P/S. If that doesn't eventuate, then existing shareholders may have reason to be optimistic about the future direction of the share price.
We don't have analyst forecasts, but you can see how recent trends are setting up the company for the future by checking out our free report on Oliver's Real Food's earnings, revenue and cash flow.Is There Any Revenue Growth Forecasted For Oliver's Real Food?
There's an inherent assumption that a company should underperform the industry for P/S ratios like Oliver's Real Food's to be considered reasonable.
Taking a look back first, we see that the company managed to grow revenues by a handy 7.2% last year. Ultimately though, it couldn't turn around the poor performance of the prior period, with revenue shrinking 6.1% in total over the last three years. So unfortunately, we have to acknowledge that the company has not done a great job of growing revenue over that time.
Comparing that to the industry, which is predicted to deliver 3.3% growth in the next 12 months, the company's downward momentum based on recent medium-term revenue results is a sobering picture.
With this information, we are not surprised that Oliver's Real Food is trading at a P/S lower than the industry. However, we think shrinking revenues are unlikely to lead to a stable P/S over the longer term, which could set up shareholders for future disappointment. There's potential for the P/S to fall to even lower levels if the company doesn't improve its top-line growth.
What We Can Learn From Oliver's Real Food's P/S?
Oliver's Real Food's P/S has taken a dip along with its share price. While the price-to-sales ratio shouldn't be the defining factor in whether you buy a stock or not, it's quite a capable barometer of revenue expectations.
It's no surprise that Oliver's Real Food maintains its low P/S off the back of its sliding revenue over the medium-term. At this stage investors feel the potential for an improvement in revenue isn't great enough to justify a higher P/S ratio. Given the current circumstances, it seems unlikely that the share price will experience any significant movement in either direction in the near future if recent medium-term revenue trends persist.
Don't forget that there may be other risks. For instance, we've identified 4 warning signs for Oliver's Real Food (3 can't be ignored) you should be aware of.
Of course, profitable companies with a history of great earnings growth are generally safer bets. So you may wish to see this free collection of other companies that have reasonable P/E ratios and have grown earnings strongly.
New: AI Stock Screener & Alerts
Our new AI Stock Screener scans the market every day to uncover opportunities.
• Dividend Powerhouses (3%+ Yield)• Undervalued Small Caps with Insider Buying• High growth Tech and AI CompaniesOr build your own from over 50 metrics.
Explore Now for FreeHave feedback on this article? Concerned about the content? Get in touch with us directly. Alternatively, email editorial-team (at) simplywallst.com.This article by Simply Wall St is general in nature. We provide commentary based on historical data and analyst forecasts only using an unbiased methodology and our articles are not intended to be financial advice. It does not constitute a recommendation to buy or sell any stock, and does not take account of your objectives, or your financial situation. We aim to bring you long-term focused analysis driven by fundamental data. Note that our analysis may not factor in the latest price-sensitive company announcements or qualitative material. Simply Wall St has no position in any stocks mentioned.
免責聲明:投資有風險,本文並非投資建議,以上內容不應被視為任何金融產品的購買或出售要約、建議或邀請,作者或其他用戶的任何相關討論、評論或帖子也不應被視為此類內容。本文僅供一般參考,不考慮您的個人投資目標、財務狀況或需求。TTM對信息的準確性和完整性不承擔任何責任或保證,投資者應自行研究並在投資前尋求專業建議。
熱議股票
- 1
- 2
- 3
- 4
- 5
- 6
- 7
- 8
- 9
- 10