ETH/BTC Ratio Sinks to Lowest in 42 Months as Ethereum Trails Bitcoin $98,000 Trend
- ETH/BTC ratio hits a 42-month low at 0.033, reflecting Bitcoin's dominance as ETH struggles to regain its 2021 all-time high.
- Exchange inflows for ETH reached 461,901 tokens ($1.50B), signaling increased selling pressure and potential downside risks.
- ETH may decline to $3,083 if selling persists, but a rally above $3,500 could shift momentum toward reclaiming $4,000.
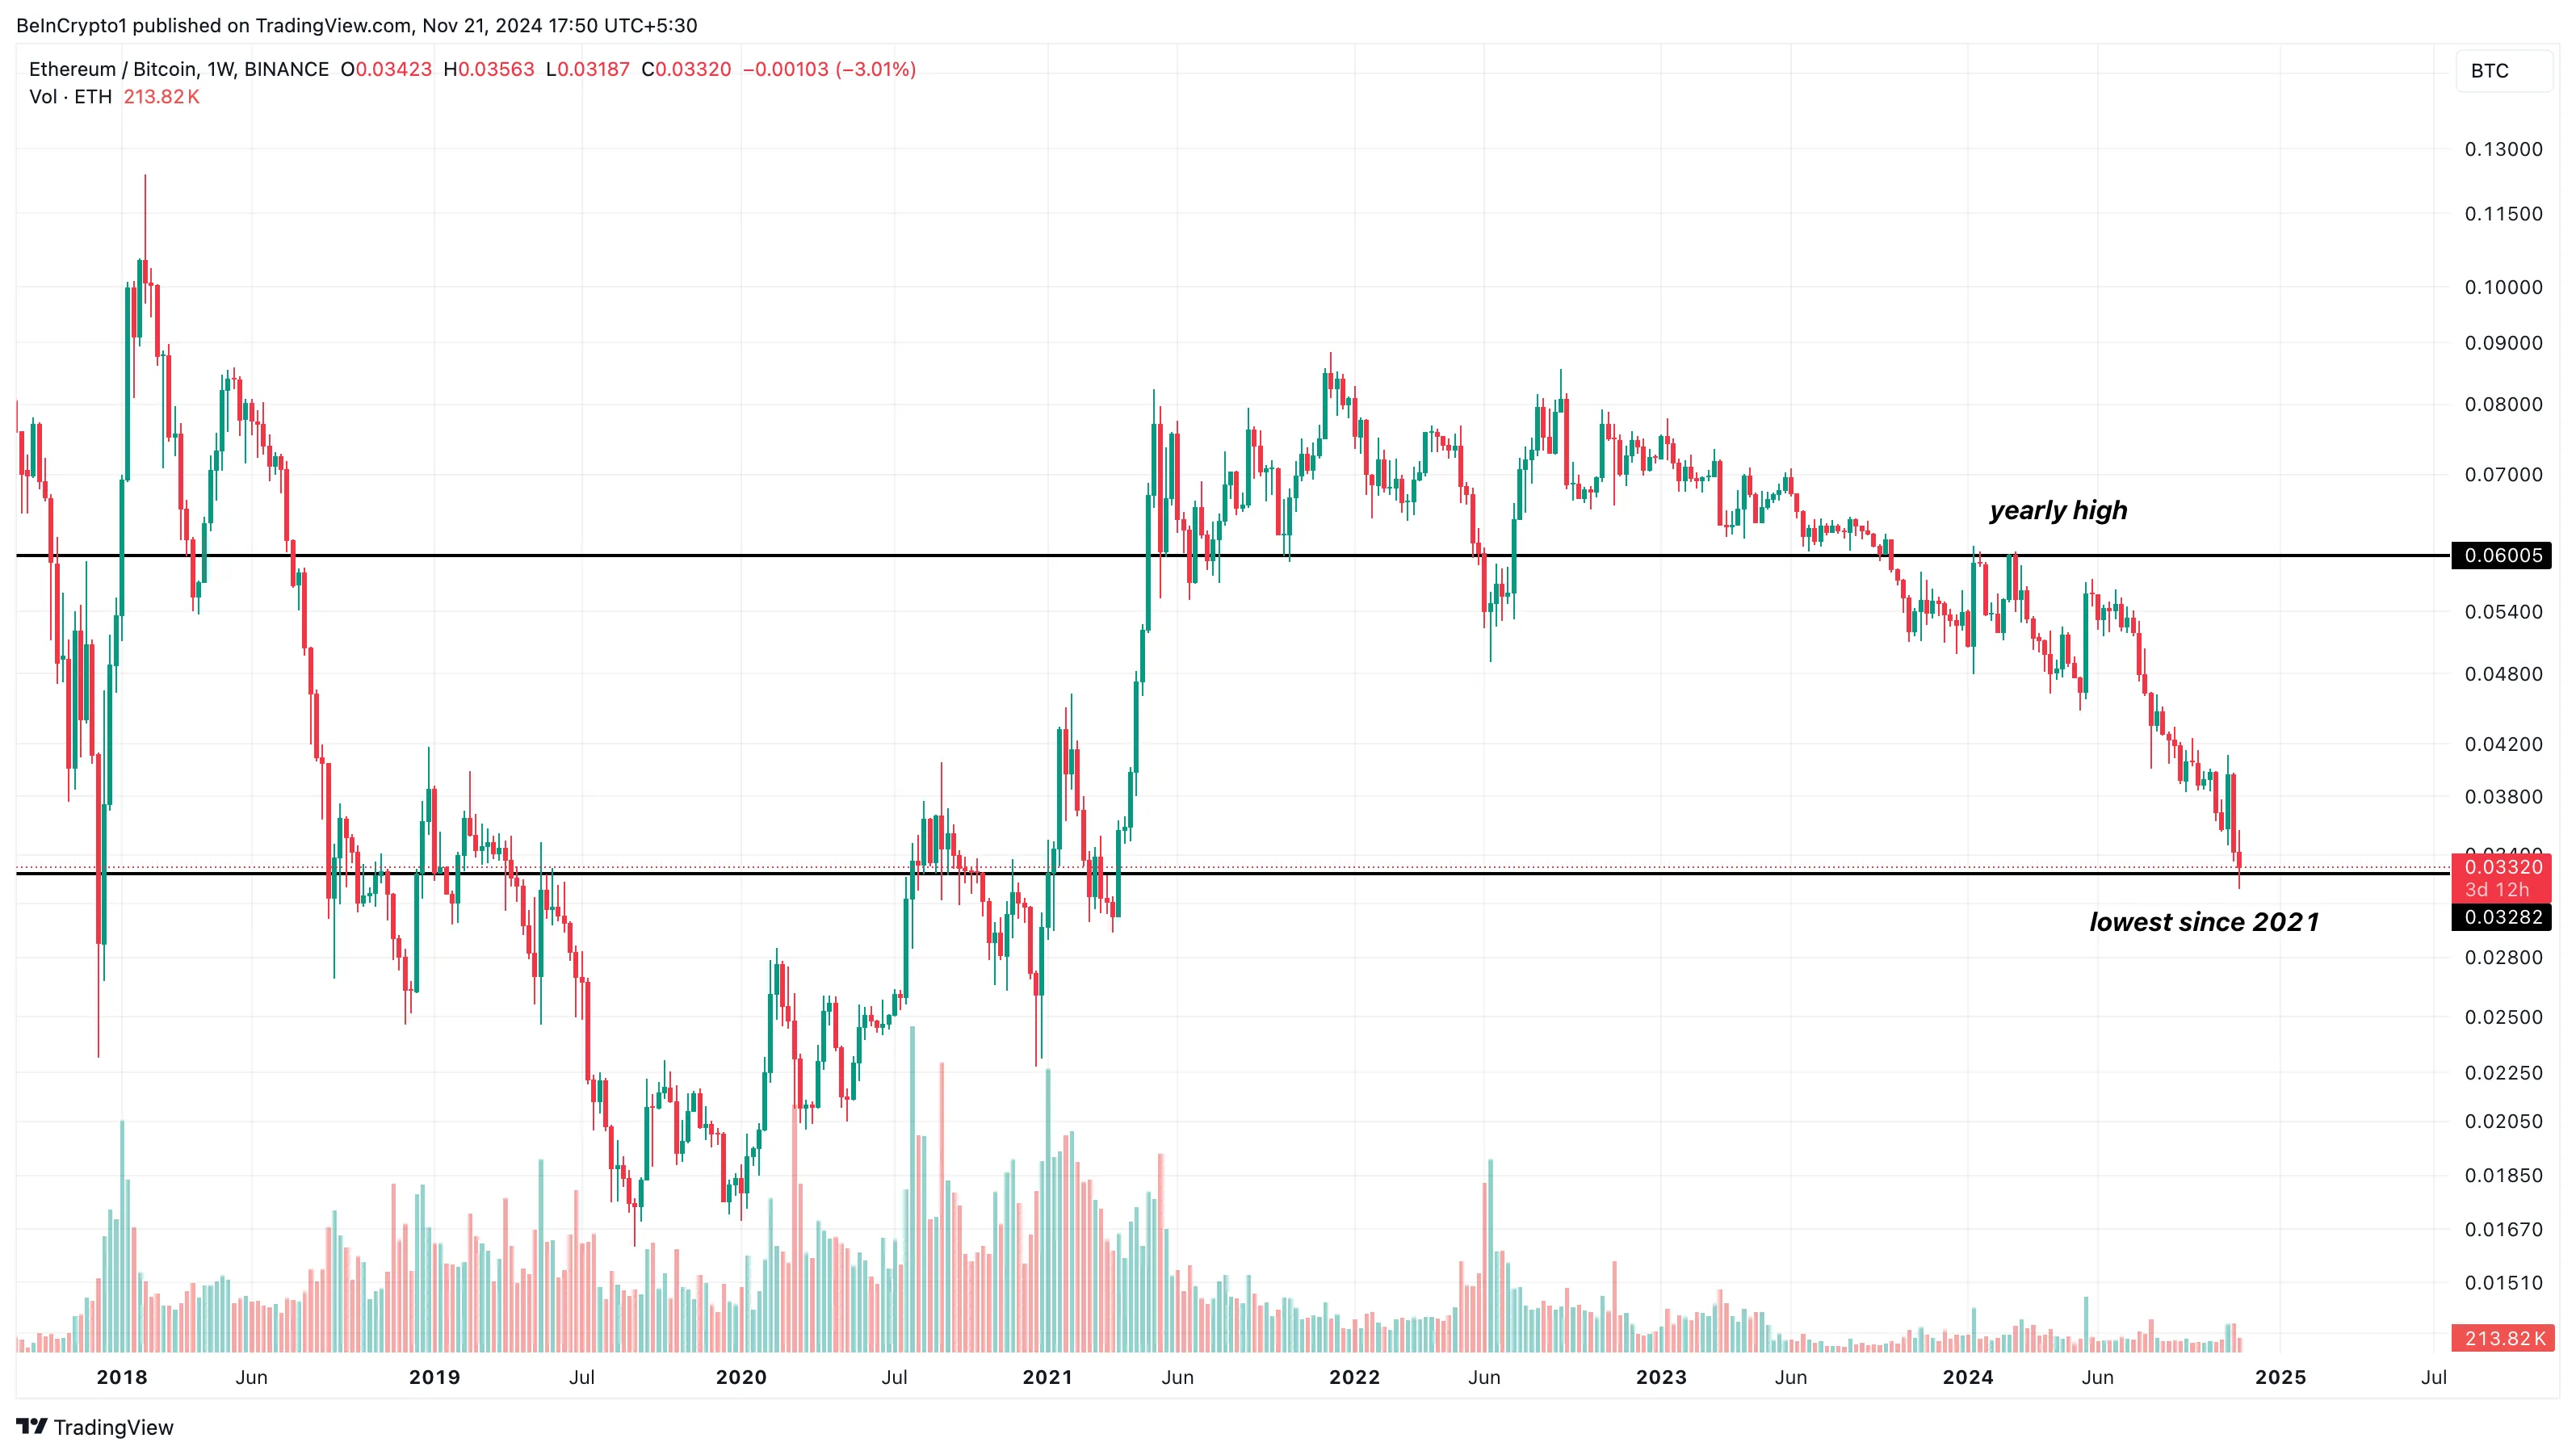
The ETH/BTC ratio, a metric measuring Ethereum’s price performance compared to Bitcoin, has reached its lowest point since March 2021. This development comes amid BTC’s brief rise to $98,000.
While the flagship cryptocurrency has increased by 7.45% in the last seven days, ETH has hovered around the same region, with investors raising concerns about the altcoin’s future.
Ethereum Continues to Lag Behind Bitcoin
In February, the ETH/BTC ratio climbed to a yearly high of 0.060. During that time, speculation spread that Ethereum’s price would begin to outperform Bitcoin and validate the altcoin season. However, that has not happened, as Bitcoin’s price has continued to make new highs
Ethereum, on the other hand, is yet to retest to reclaim its all-time high despite reaching $4,000 earlier in the year. This disparity in performance could be linked to several factors. For instance, both cryptocurrencies saw approval for exchange-traded funds (ETFs) this year.
However, while Bitcoin has seen billions of dollars in inflows, ETH has been inconsistent in attracting capital. Hence, the institutional inflow has driven BTC toward $100,000, ensuring that the ETH/BTC ratio drops to $0.033 — the lowest level in 42 months.
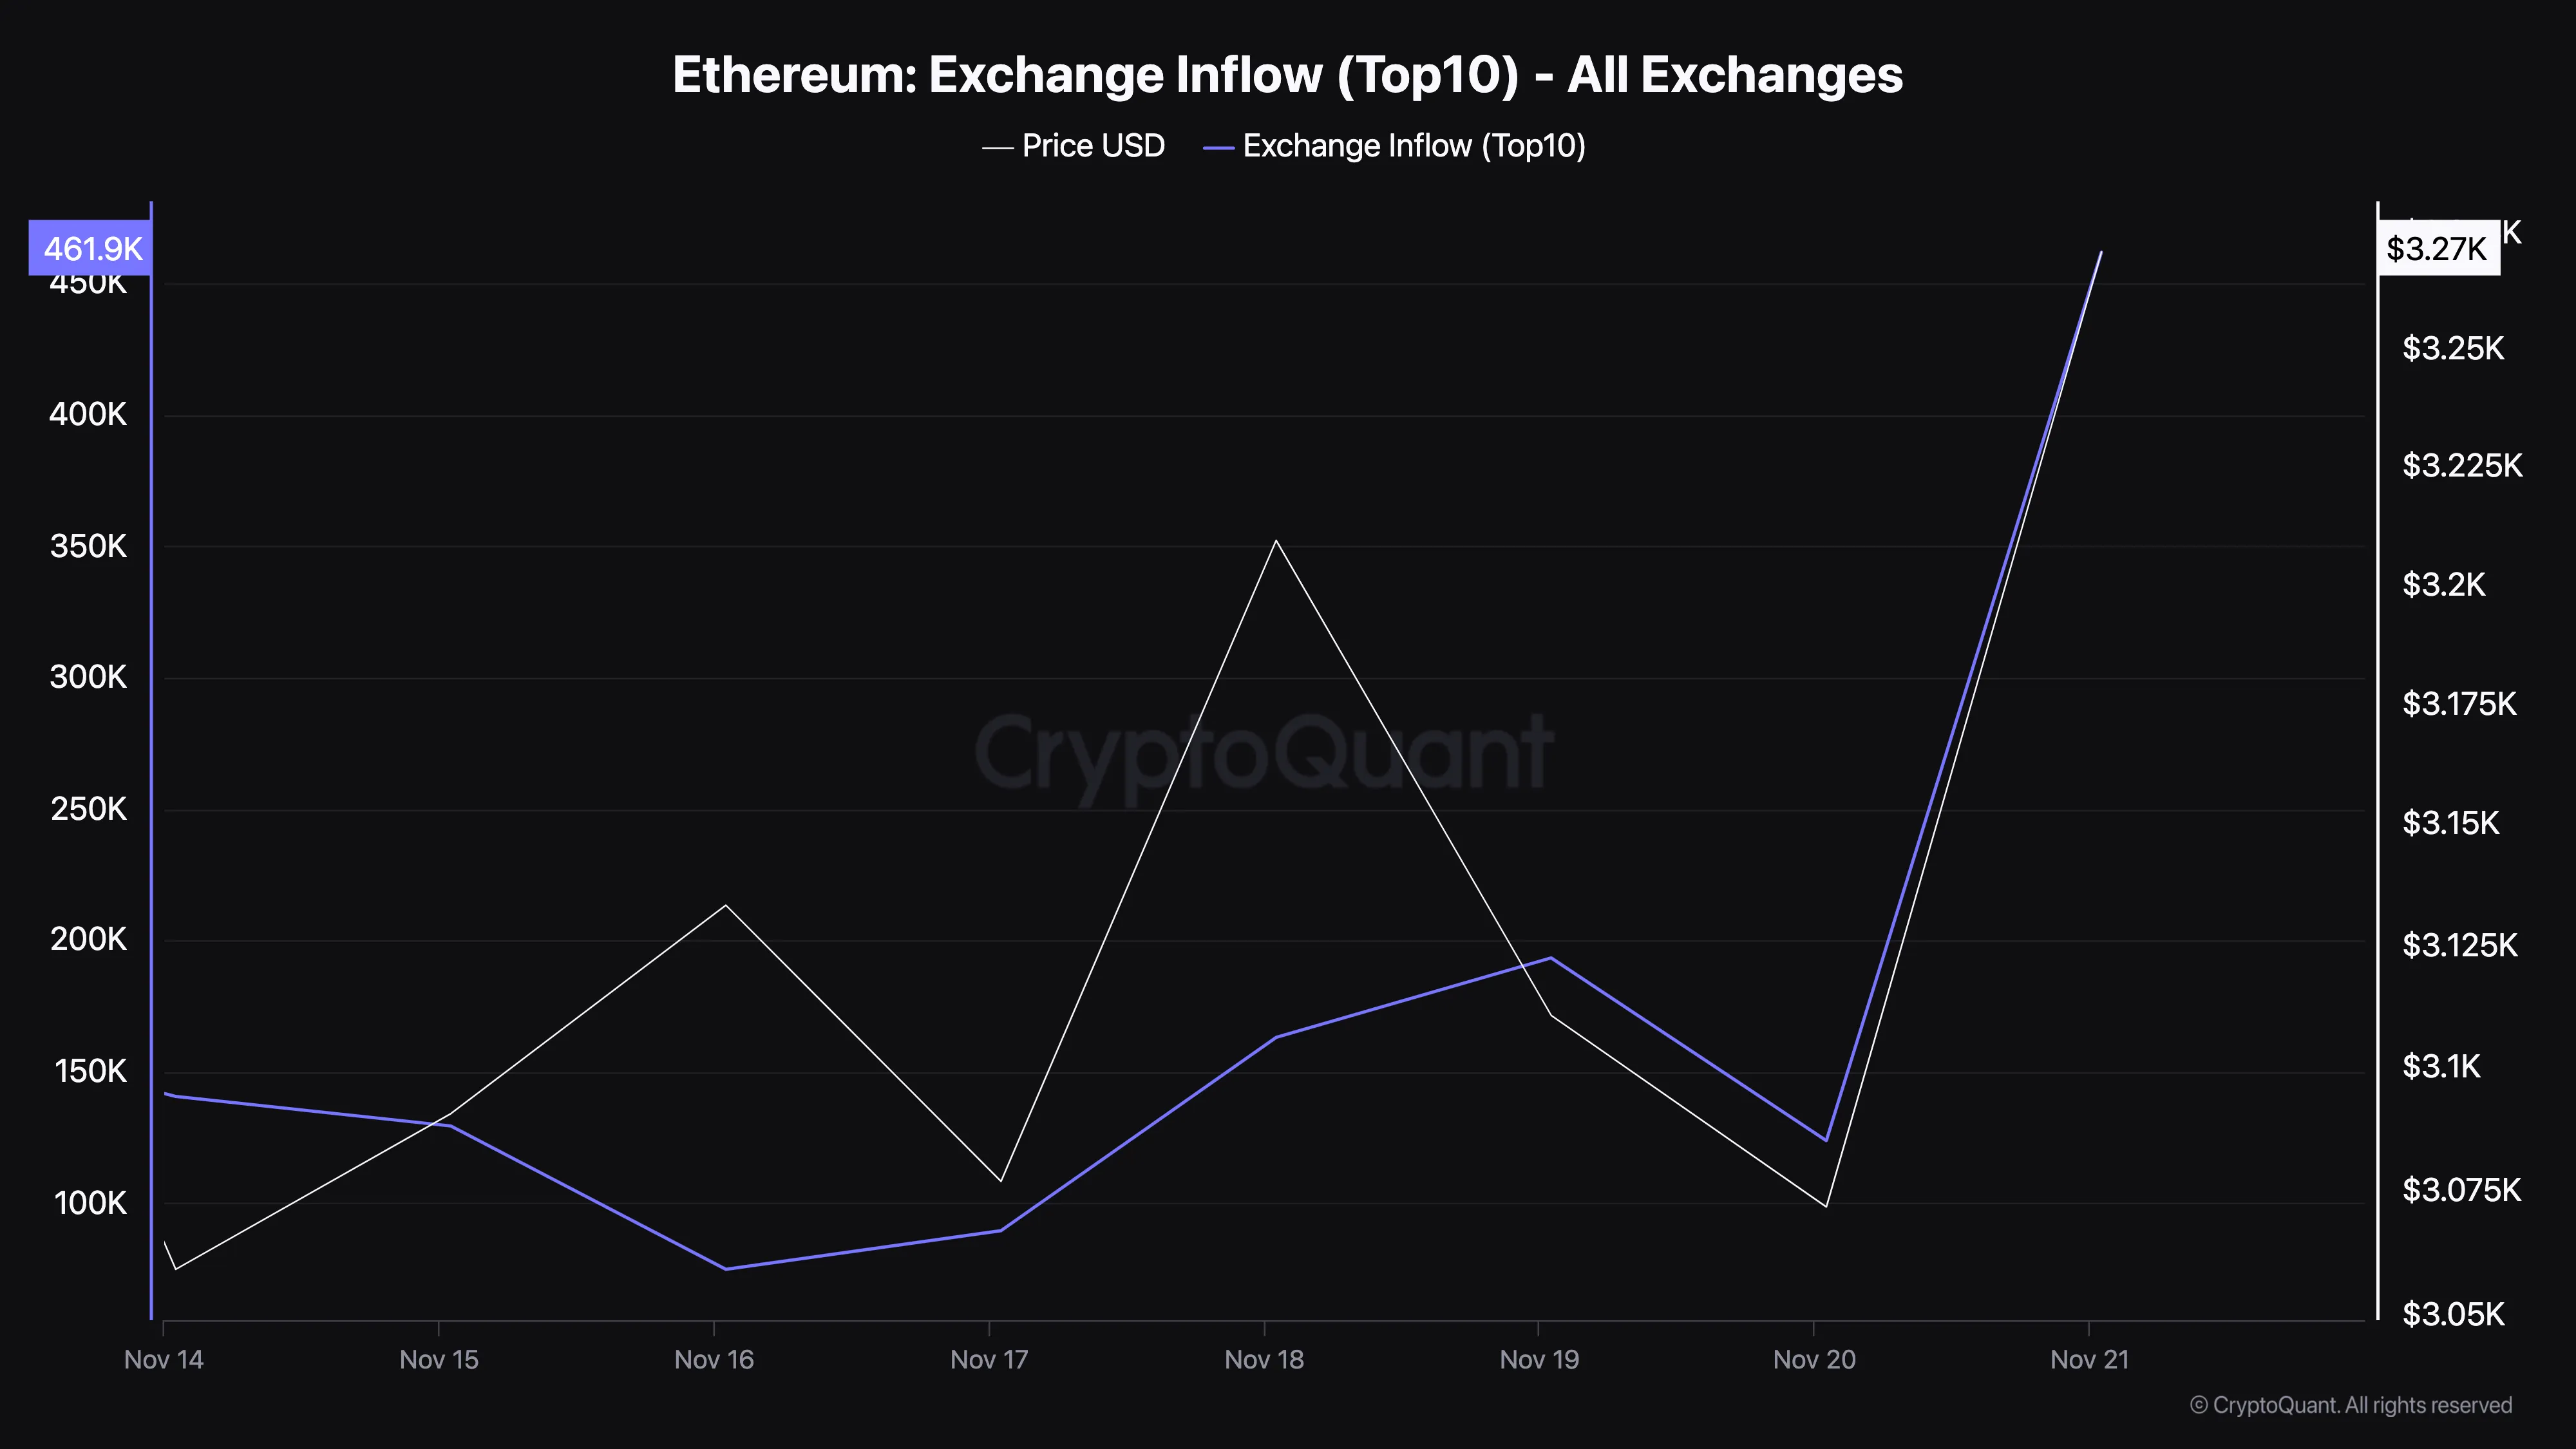
Further, the disparity in Ethereum’s performance can largely be attributed to sustained selling pressure. For instance, CryptoQuant data reveals that exchange inflows into the top 10 exchanges have climbed to 461,901 ETH, valued at approximately $1.50 billion as of this writing.
This surge in exchange inflow reflects large deposits by investors, indicating a heightened willingness to sell. Such movements typically increase the supply of ETH on exchanges, raising the likelihood of a price drop.
In contrast, a low exchange inflow generally indicates that investors are holding onto their assets, which is not the current scenario for ETH.
ETH Price Prediction: Crypto Could Retrace
As of this writing, ETH trades at $3,317, which is a higher close than yesterday’s. Despite that, the altcoin is still below the Parabolic Stop And Reverse (SAR) indicator. The Parabolic SAR generates a series of dots that track the price movement, positioning above the price during a downtrend and below the price during an uptrend.
A “flip” in the dots — shifting from one side to the other — often signals a potential trend reversal. As seen below, the indicator is above ETH’s price, suggesting that the cryptocurrency could reverse its recent gains.
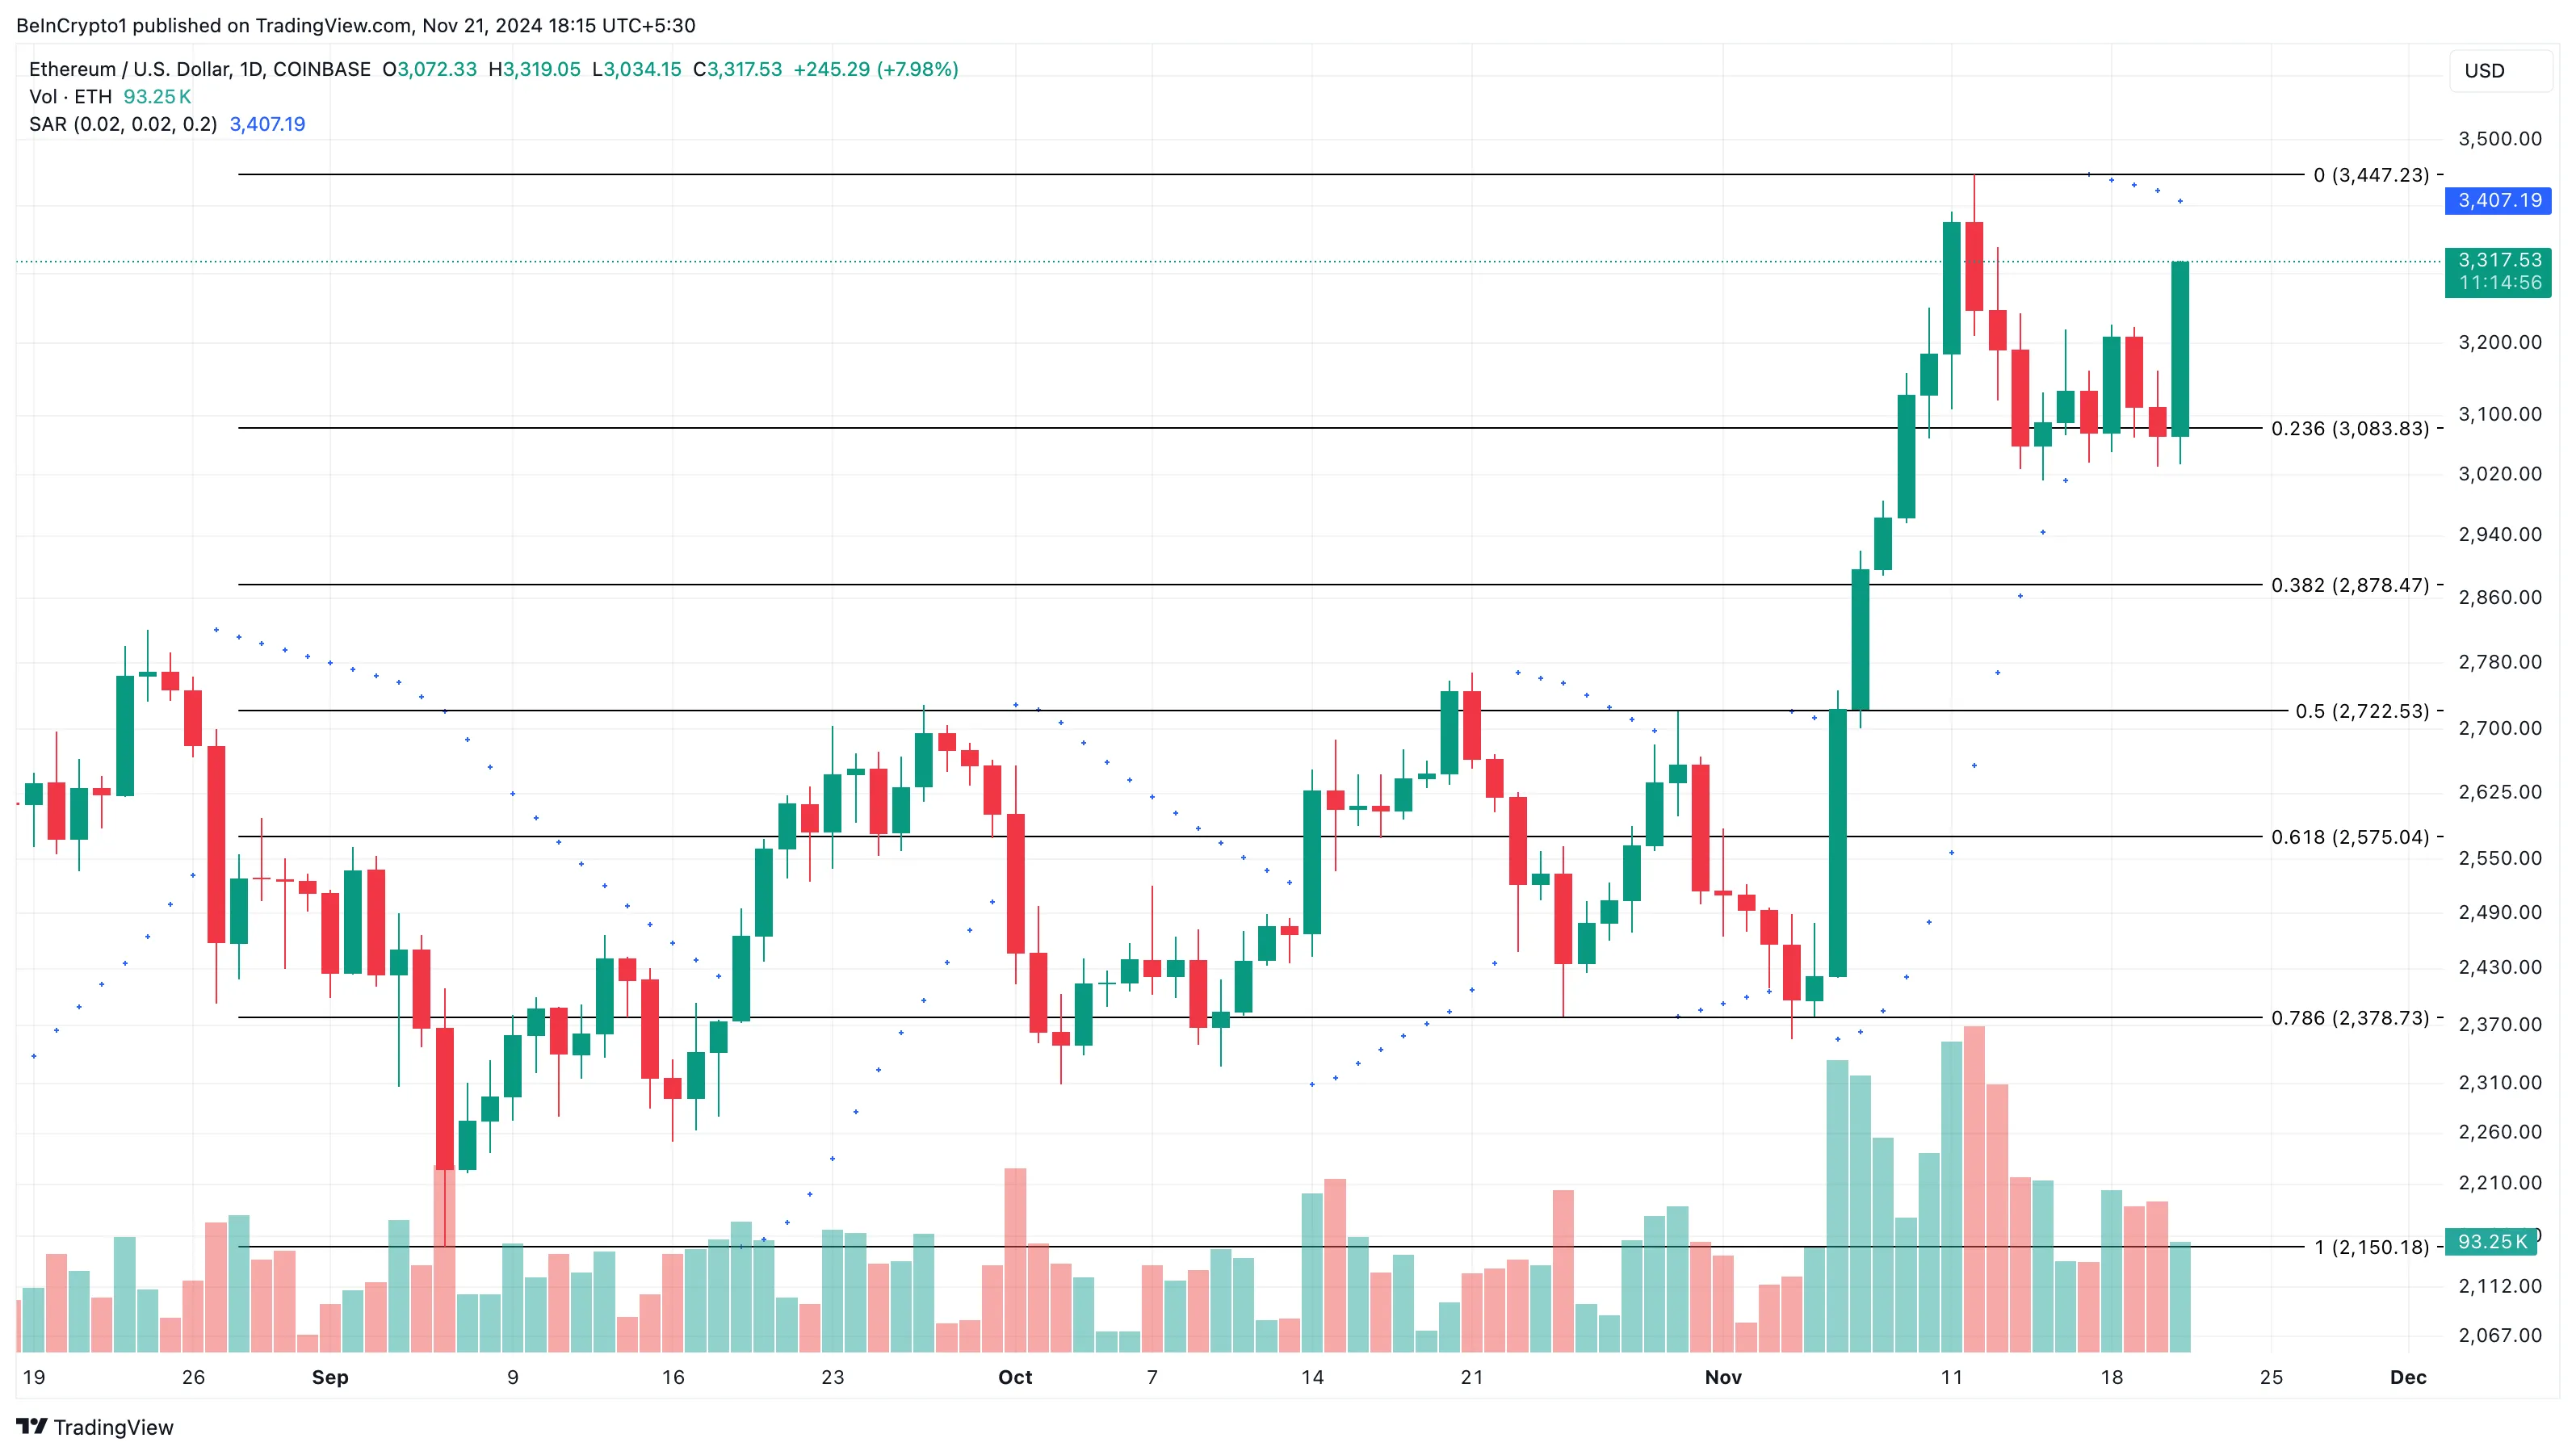
If this is the case and the ETH/BTC ratio declines, Ethereum’s price could decline to $3,083. However, if buying pressure increases, that might not happen. Instead, the value could surge above $3,500 and toward 4,000.
免責聲明:投資有風險,本文並非投資建議,以上內容不應被視為任何金融產品的購買或出售要約、建議或邀請,作者或其他用戶的任何相關討論、評論或帖子也不應被視為此類內容。本文僅供一般參考,不考慮您的個人投資目標、財務狀況或需求。TTM對信息的準確性和完整性不承擔任何責任或保證,投資者應自行研究並在投資前尋求專業建議。
熱議股票
- 1
- 2
- 3
- 4
- 5
- 6
- 7
- 8
- 9
- 10