Mantra (OM) Price Hits All-Time High but Momentum Shows Signs of Weakness
- Explosive Rally: Mantra (OM) price surged 155% in a week, reaching an all-time high on November 18, showcasing strong bullish momentum.
- RSI Turns Neutral: OM's RSI dropped to 52.7 from overbought levels, indicating eased buying pressure and a balanced market.
- Weakened Uptrend: The Ichimoku Cloud shows OM nearing key support, with risks of transitioning into a bearish trend if it drops below $2.98.
Mantra (OM) price recently broke a new all-time high on November 18 and has surged 155.29% in the last seven days. This explosive rally highlights the strong bullish momentum that has pushed OM to its highest levels yet.
However, recent indicators, including RSI and the Ichimoku Cloud, suggest the uptrend may be weakening.
OM RSI Shows The Neutral Zone
OM’s Relative Strength Index (RSI) is currently at 52.7, down from the overbought levels it reached between November 16 and November 18 when it stayed above 70 and Mantra price hit new all-time highs, as the narrative around real-world assets (RWA) keeps growing.
This decline indicates a slowdown in buying momentum, suggesting that the strong upward pressure seen earlier has eased. The shift reflects a more balanced market where buyers and sellers are now exerting similar influence on OM price.
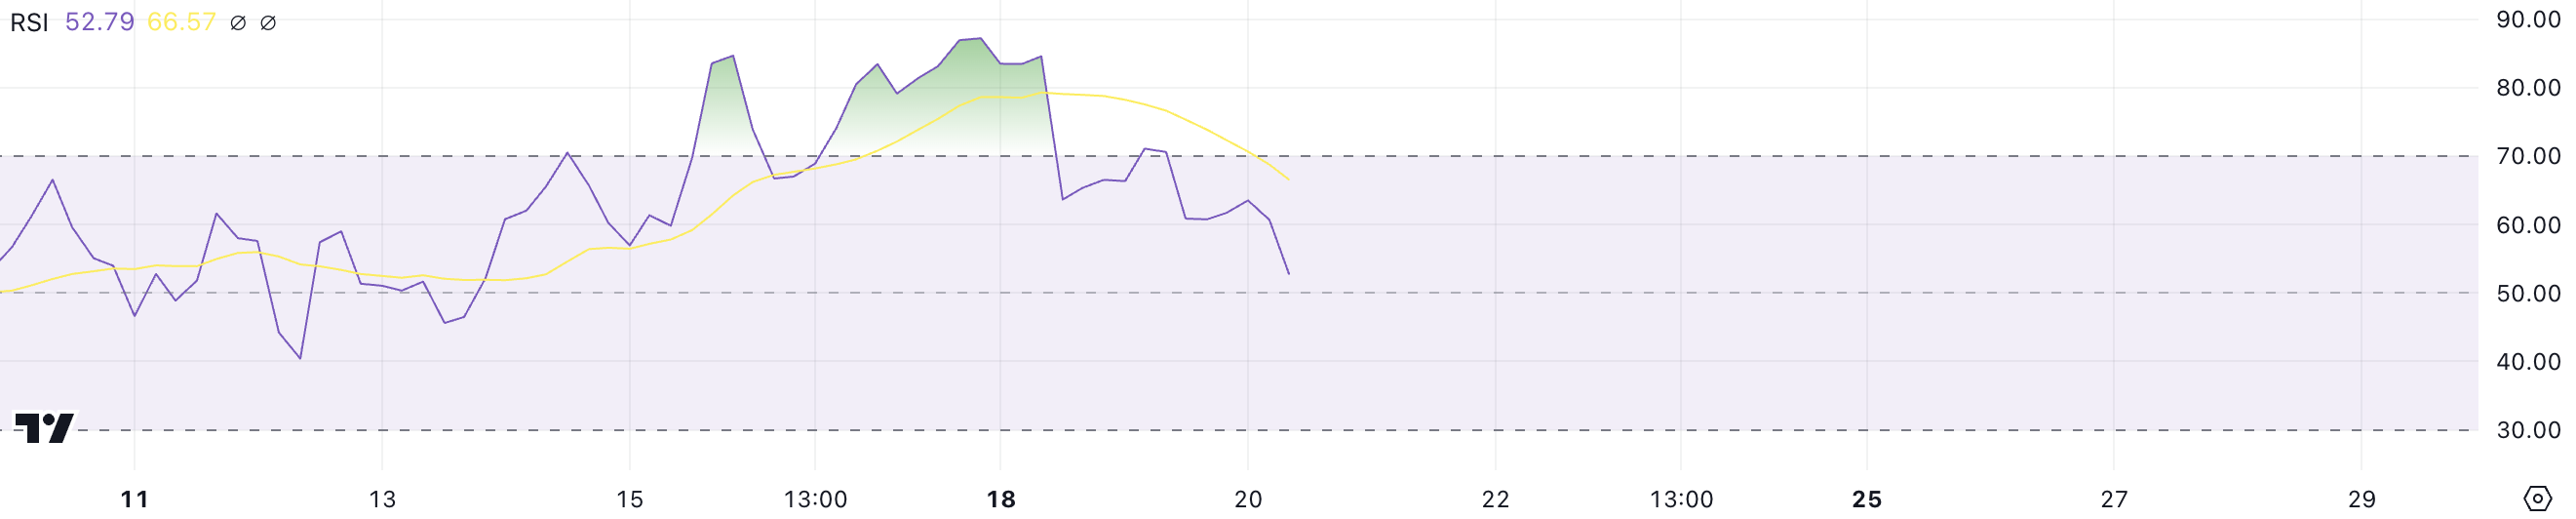
RSI gauges the strength of price movements, with levels above 70 signaling high bullish momentum and potential overextension, while values below 30 indicate strong bearish pressure.
At 52.7, OM’s RSI is in a neutral range, suggesting the market is neither overheated nor oversold.
Ichimoku Cloud Shows Mantra Uptrend Is Weakening
The Ichimoku Cloud chart for OM indicates that the price is showing signs of weakening. The price has fallen below the Tenkan-sen (blue line), signaling a loss of short-term momentum, and it is now approaching the lower boundary of the green cloud (Kumo).
A drop below the cloud would mark a transition into a bearish trend, as the cloud typically acts as a key support zone.
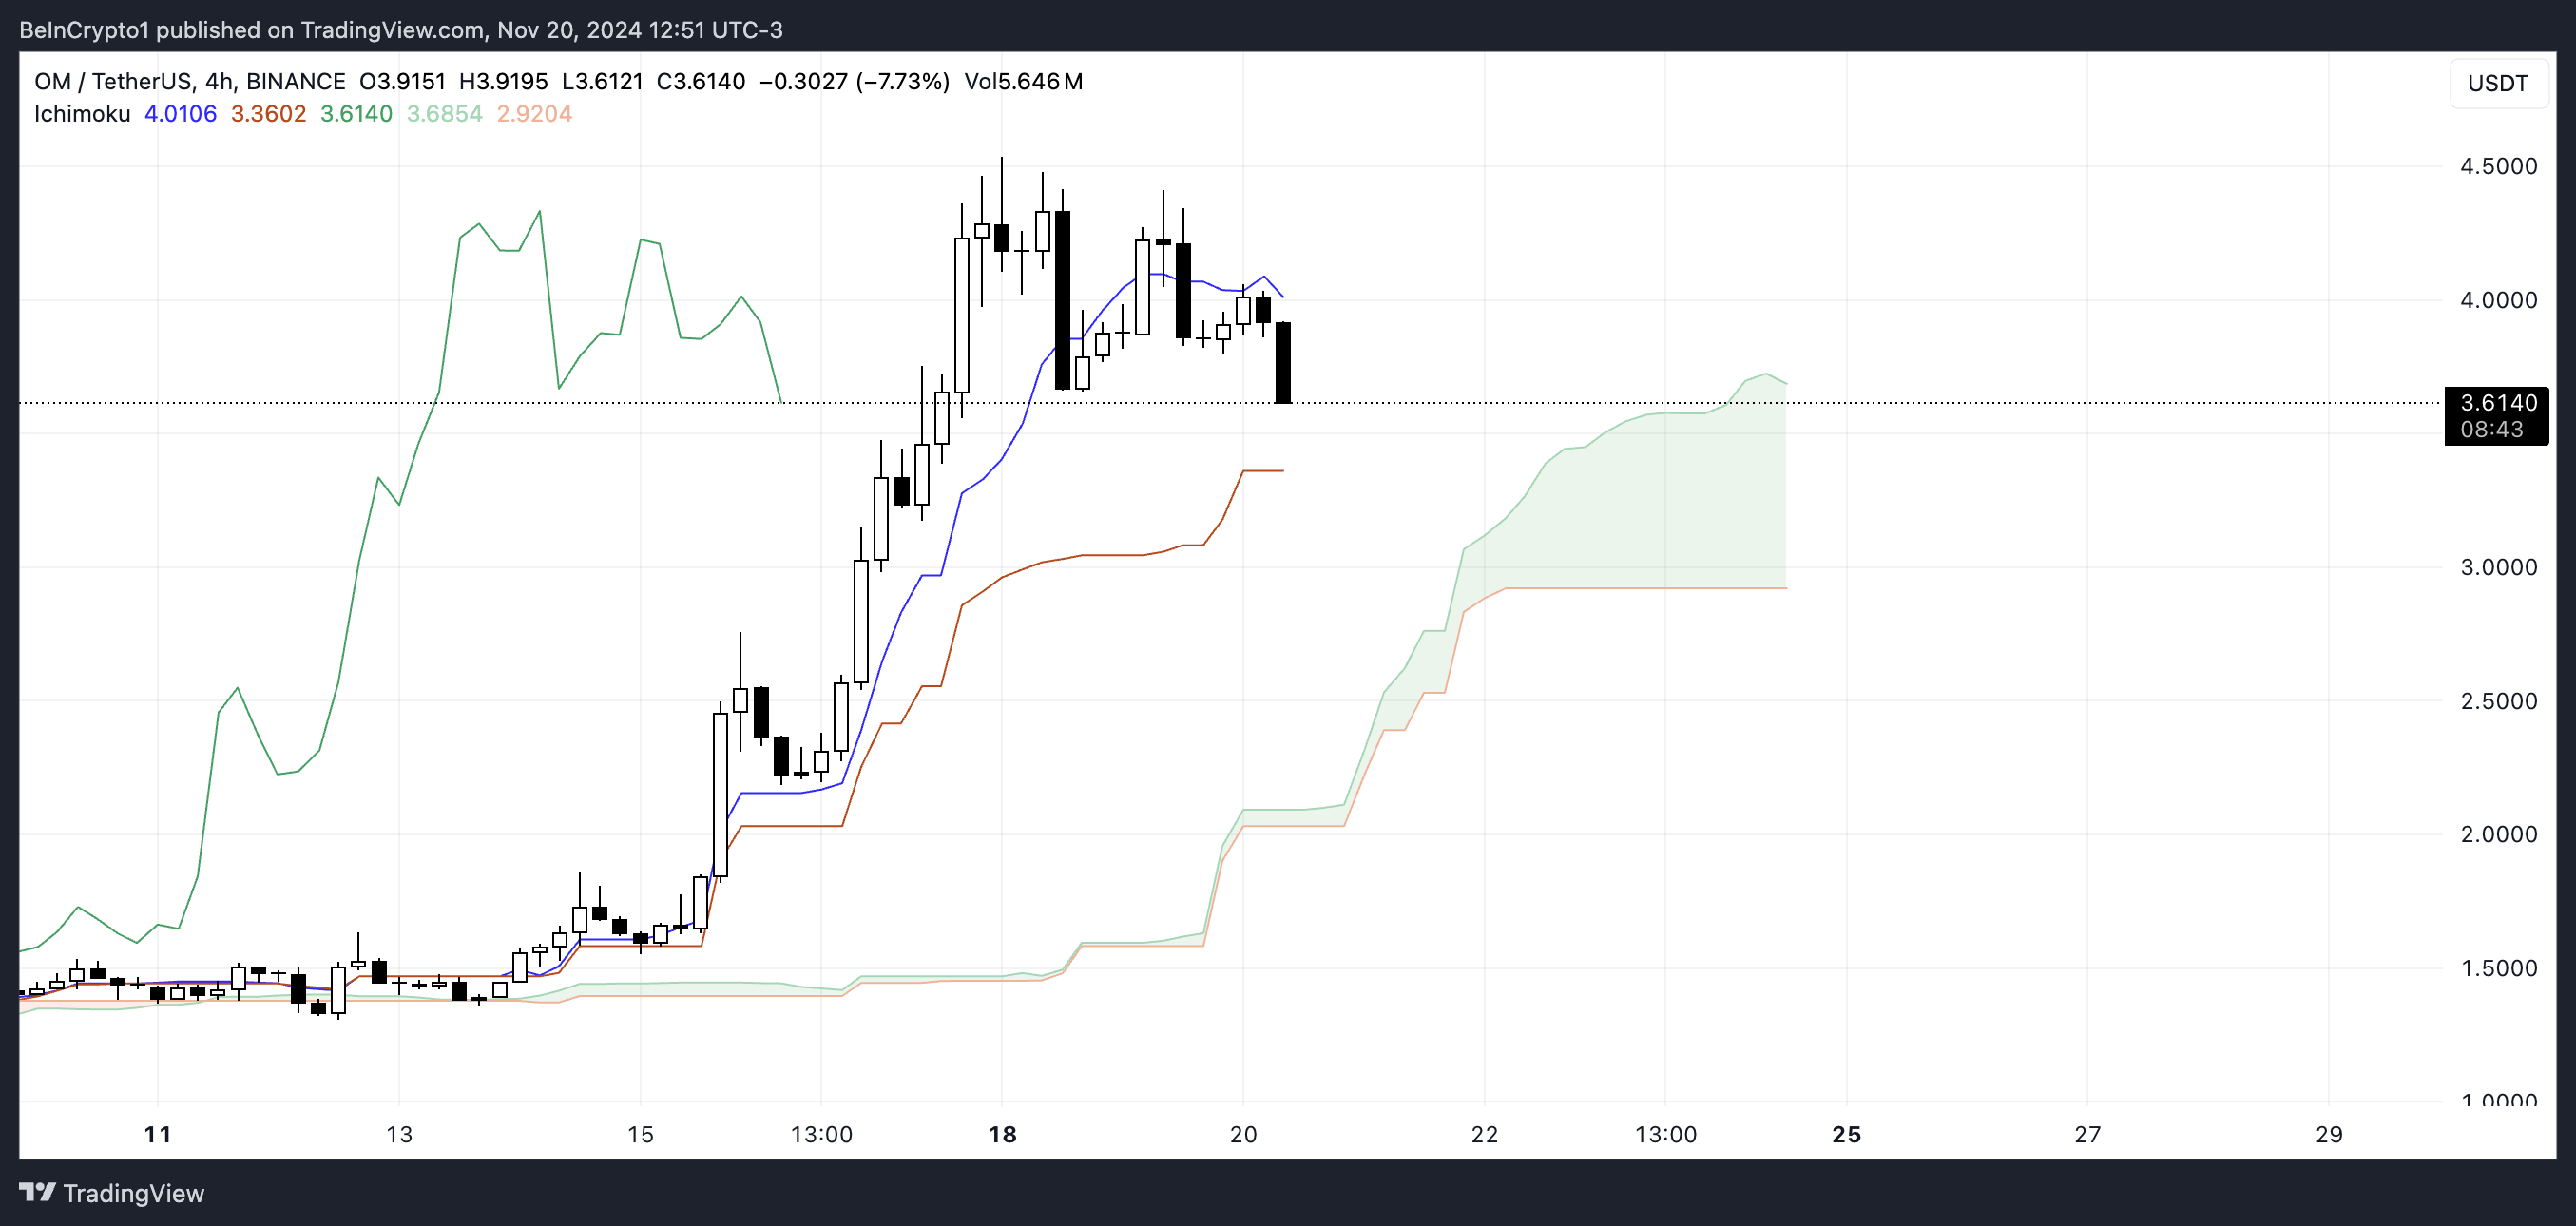
The green cloud ahead is still relatively thick, which suggests that while the overall trend may still have some support, this support is being tested.
If OM price closes below the cloud, it could indicate a potential reversal of the recent uptrend into a sustained downtrend.
OM Price Prediction: Can Mantra Go Below $3 In November?
If OM’s downtrend continues to strengthen, it could test its closest support zone at $2.98. Should this level fail to hold, the price could drop further, potentially reaching as low as $1.81.
This scenario would signal a deeper bearish reversal and a significant loss of momentum.
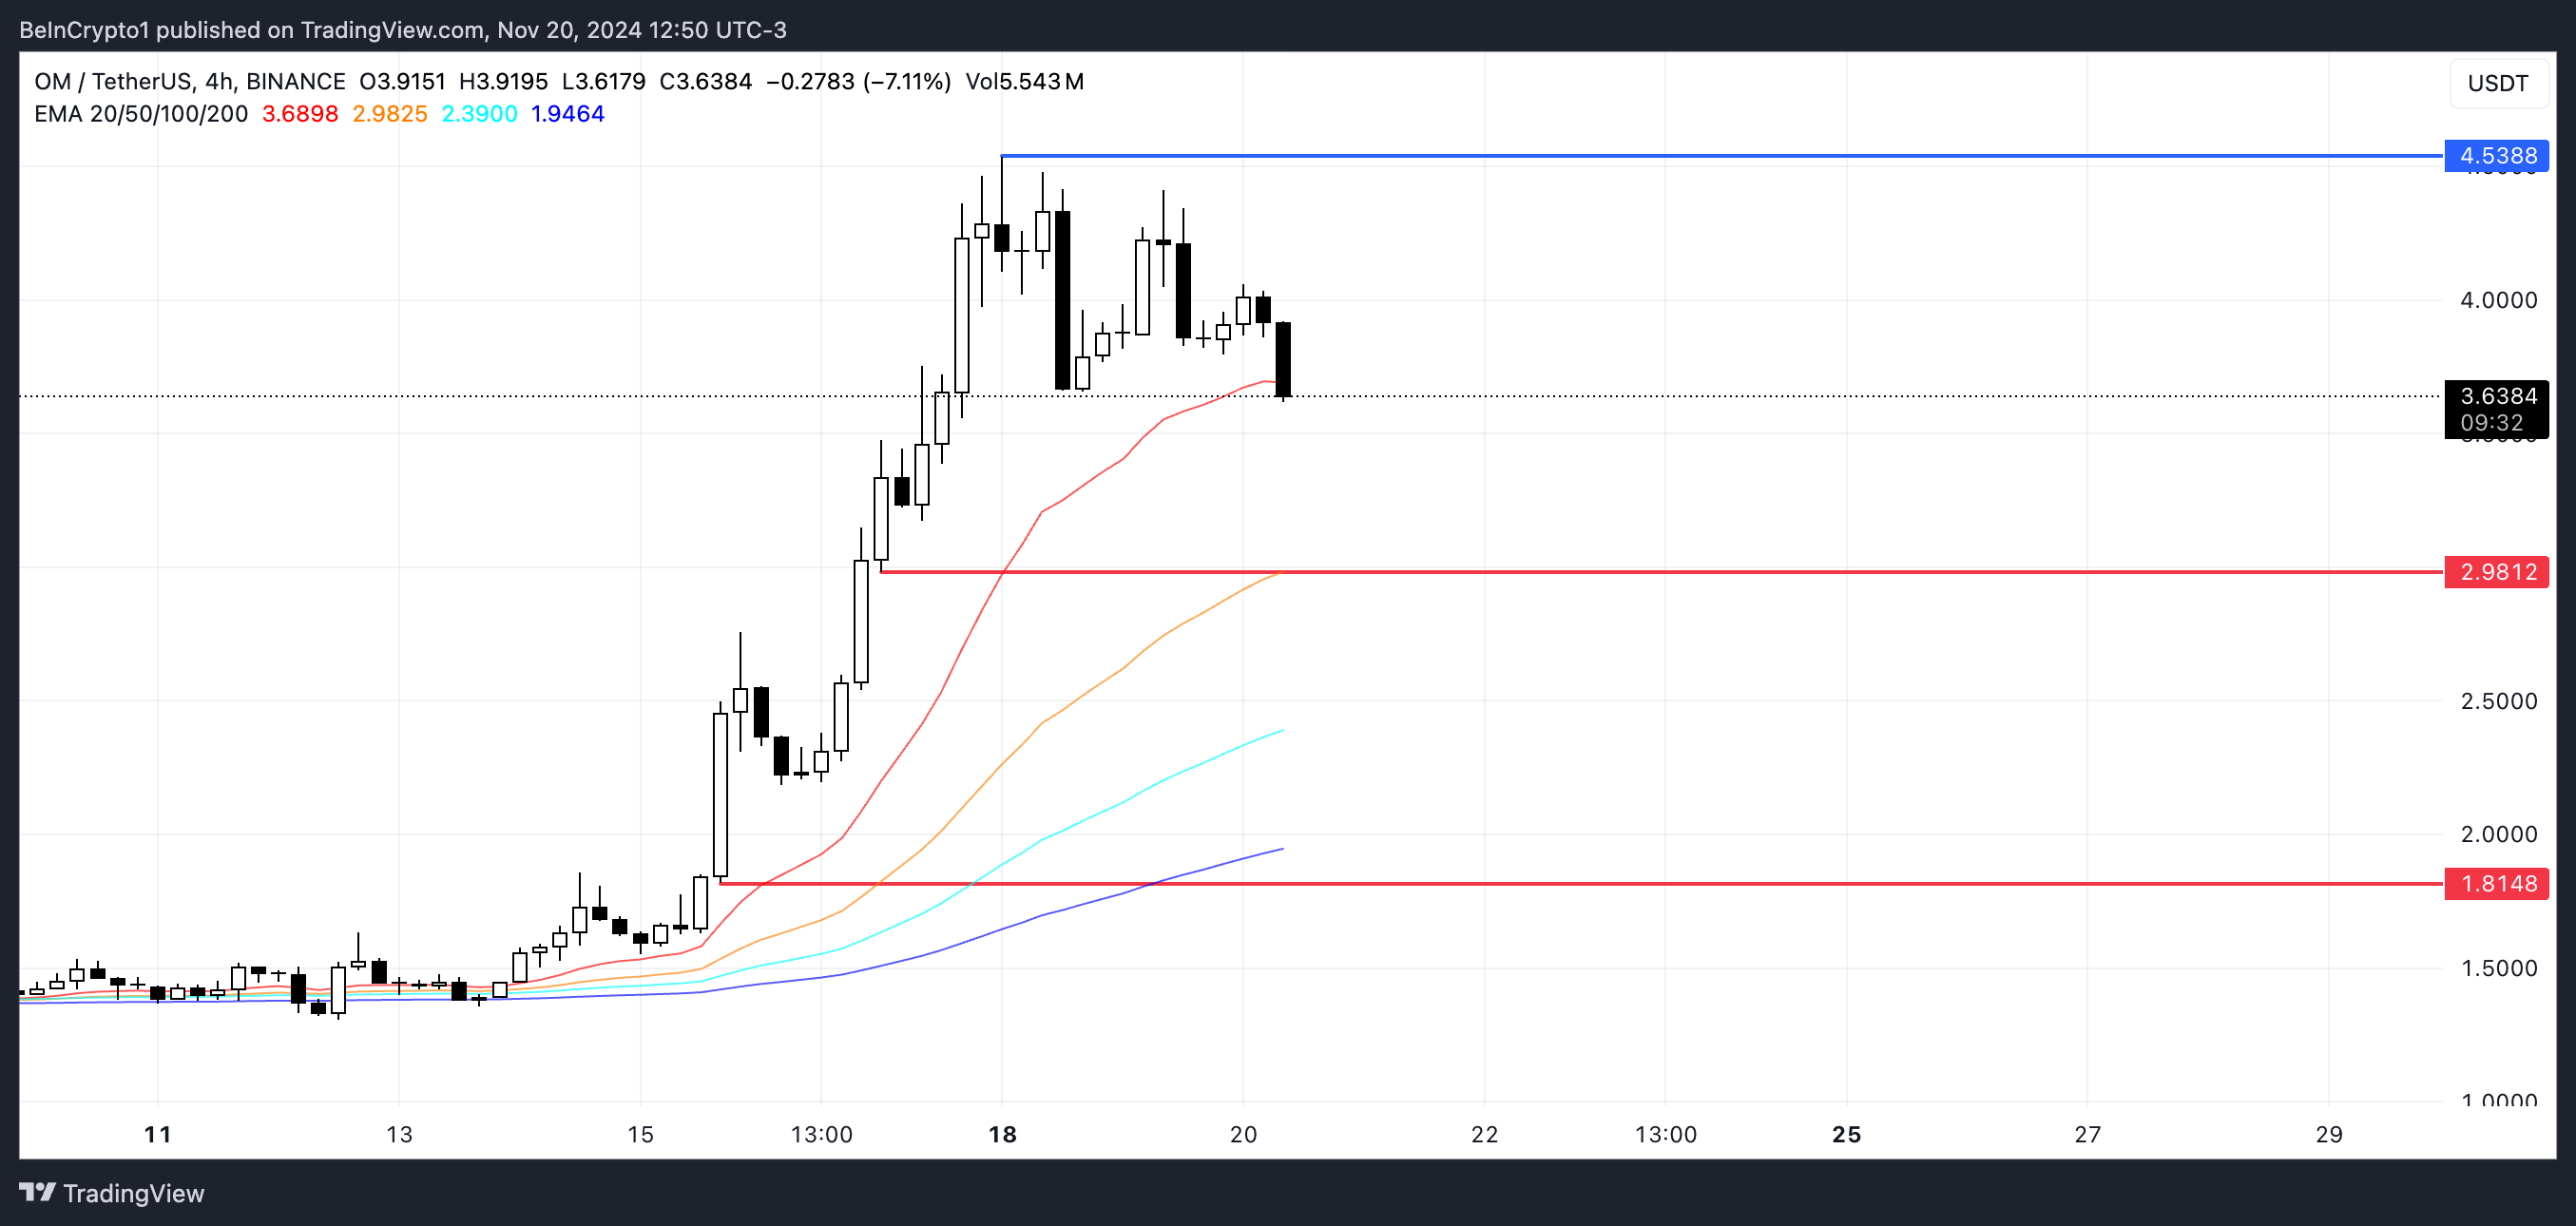
On the other hand, if the uptrend recovers, OM price could aim for new highs by testing the $4.53 resistance zone.
Breaking through this level would likely allow OM to surpass its previous peak and set a new all-time high, establishing Mantra as one of the most relevant coins in the RWA ecosystem.
免責聲明:投資有風險,本文並非投資建議,以上內容不應被視為任何金融產品的購買或出售要約、建議或邀請,作者或其他用戶的任何相關討論、評論或帖子也不應被視為此類內容。本文僅供一般參考,不考慮您的個人投資目標、財務狀況或需求。TTM對信息的準確性和完整性不承擔任何責任或保證,投資者應自行研究並在投資前尋求專業建議。
熱議股票
- 1
- 2
- 3
- 4
- 5
- 6
- 7
- 8
- 9
- 10