Solana (SOL) Price Nears All-Time High as Uptrend Continues
- Strong Rally Continues: Solana (SOL) is within 3% of its previous ATH, supported by bullish market sentiment.
- Momentum Eases: BBTrend remains positive at 9.56, but its decline signals weakening strength in the uptrend.
- Key Levels Ahead: SOL could break $260 for a new ATH, but a reversal risks testing supports at $204 and $194.
Solana (SOL) price has surged 16.96% in the last seven days and is now very close to reaching a new all-time high. The recent rally has positioned SOL just under 3% from its previous ATH, signaling strong bullish sentiment in the market.
However, indicators like BBTrend and ADX suggest that the current uptrend is losing some momentum, raising caution for potential consolidation or a pullback.
SOL BBTrend Is Still Positive
Solana currently has a BBTrend of 9.56, marking a sustained positive trend since November 18. While it remains in bullish territory, the value is down from its monthly high of 18.64 on November 10, indicating a decline in trend strength.
This suggests that while SOL is still in an uptrend, the momentum behind its recent price movements may be weakening.
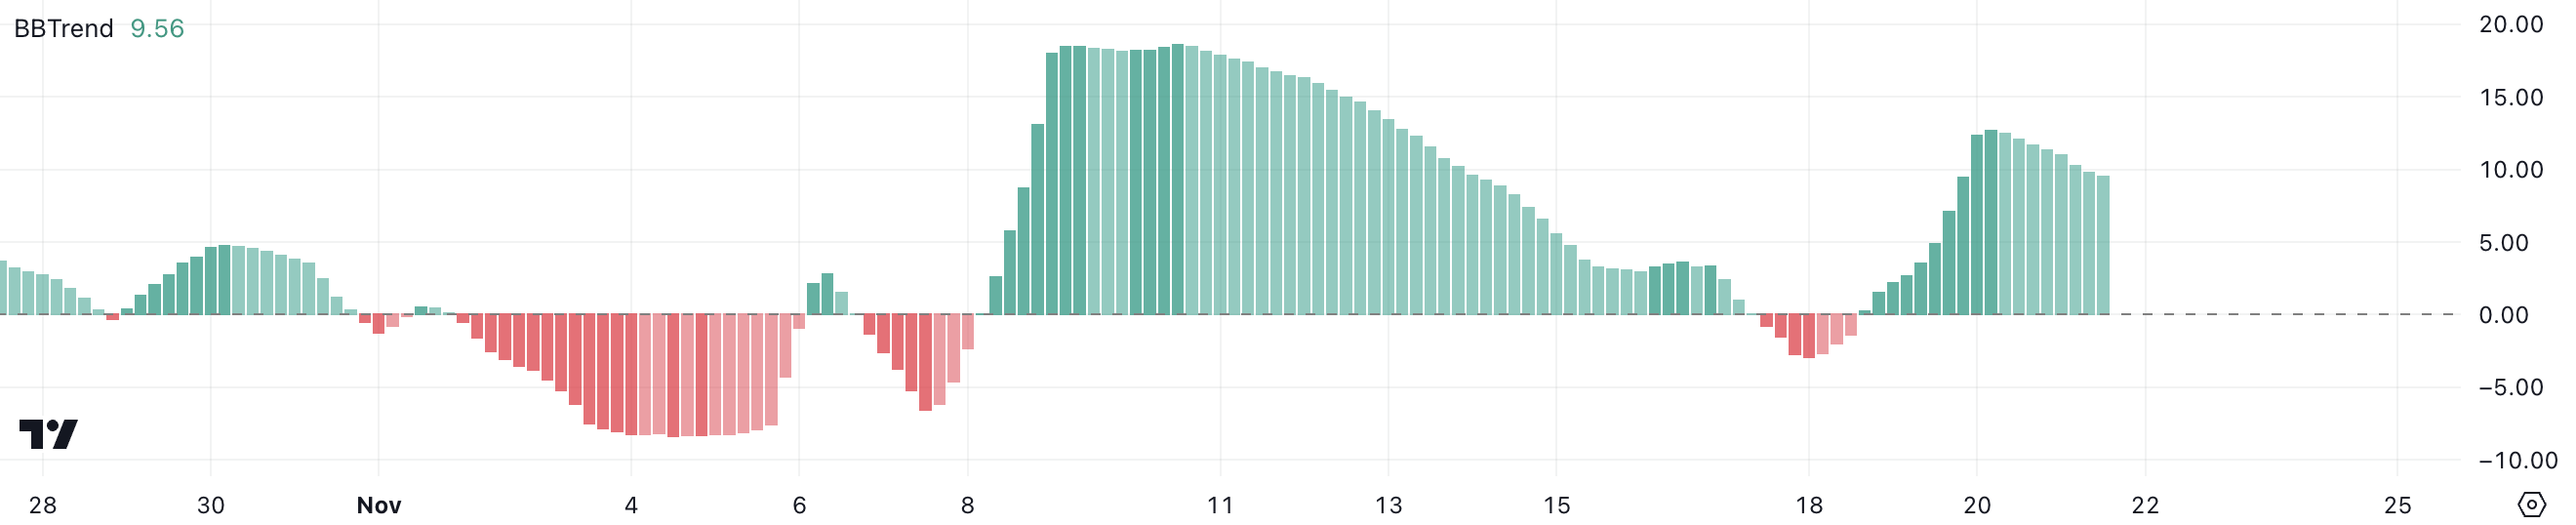
BBTrend measures the strength and direction of price trends using Bollinger Bands, with positive values signaling an uptrend and negative values indicating a downtrend.
At 9.56, SOL’s BBTrend reflects a moderate bullish sentiment, though it is far weaker compared to earlier in the month. This could mean the current uptrend is stabilizing, leaving SOL vulnerable to consolidation or a potential reversal if buying pressure diminishes further.
Solana Current Uptrend Isn’t as Strong as It Was
Solana (SOL)’s DMI chart shows its ADX at 20.71, indicating a weaker trend than earlier in the month when it was above 50.
The ADX measures the strength of a trend, regardless of its direction, with values above 25 indicating a strong trend and below 20 indicating a weak or nonexistent trend. The current value suggests that SOL’s trend has significantly weakened, reflecting reduced momentum after its earlier surge.
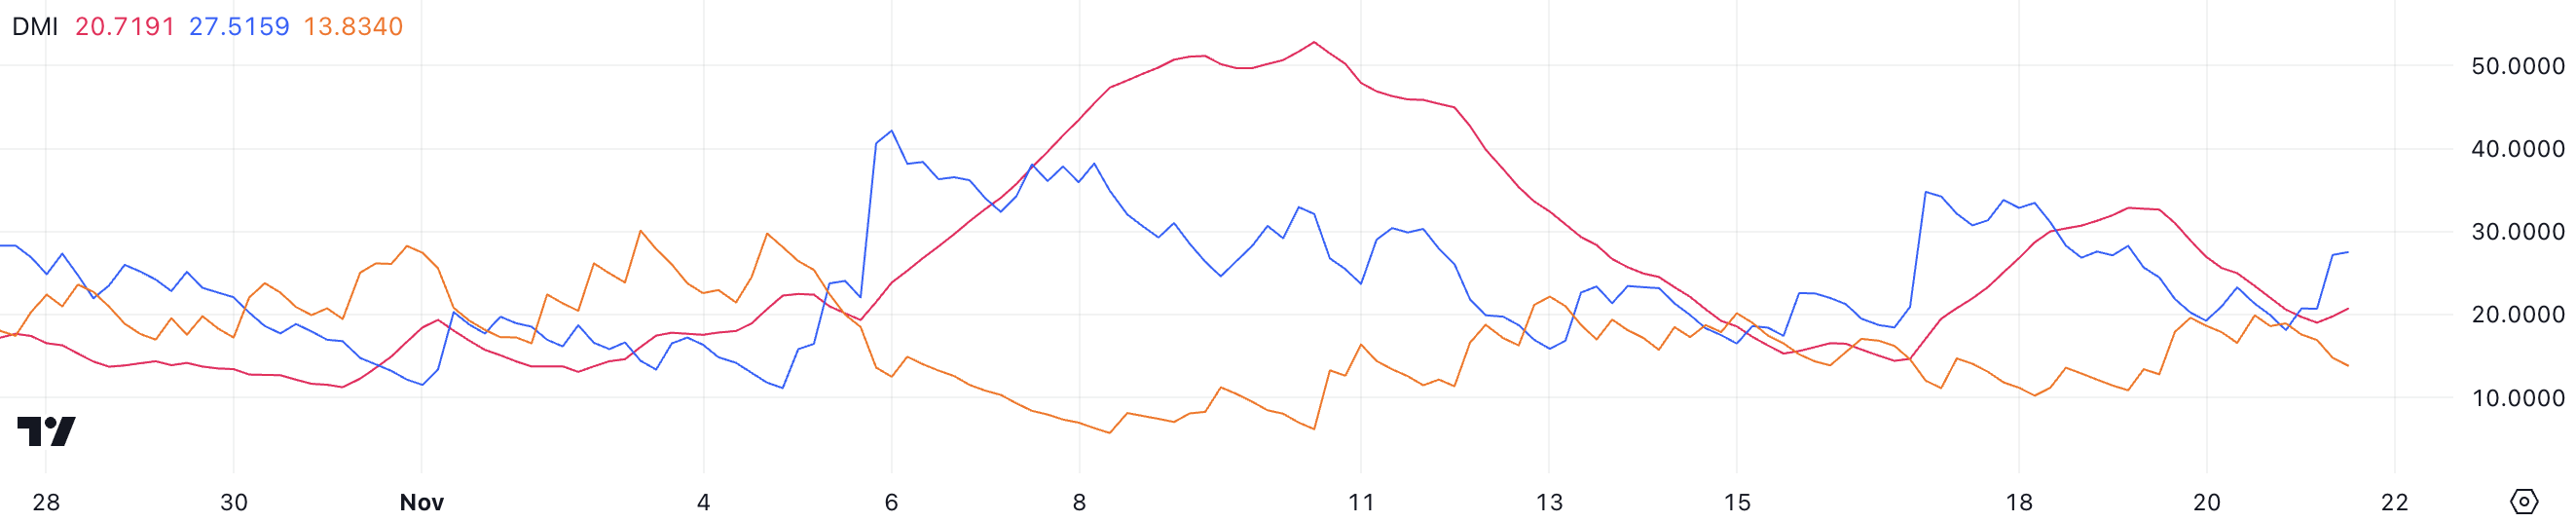
With the positive directional index (D+) at 27.5 and the negative directional index (D-) at 13.8, bullish pressure continues to outweigh bearish activity.
However, the weak ADX indicates that this bullish momentum lacks the strength to sustain significant upward movement. For SOL price to regain a strong uptrend, the ADX would need to rise above 25.
SOL Price Prediction: A New All-Time High Soon?
SOL price is currently less than 3% from its previous all-time high (ATH). If Solana maintains its current uptrend, it is positioned to rise and potentially reach a new ATH at $260.
Breaking through this level could pave the way for further gains, with the price possibly targeting $265 or even $270.
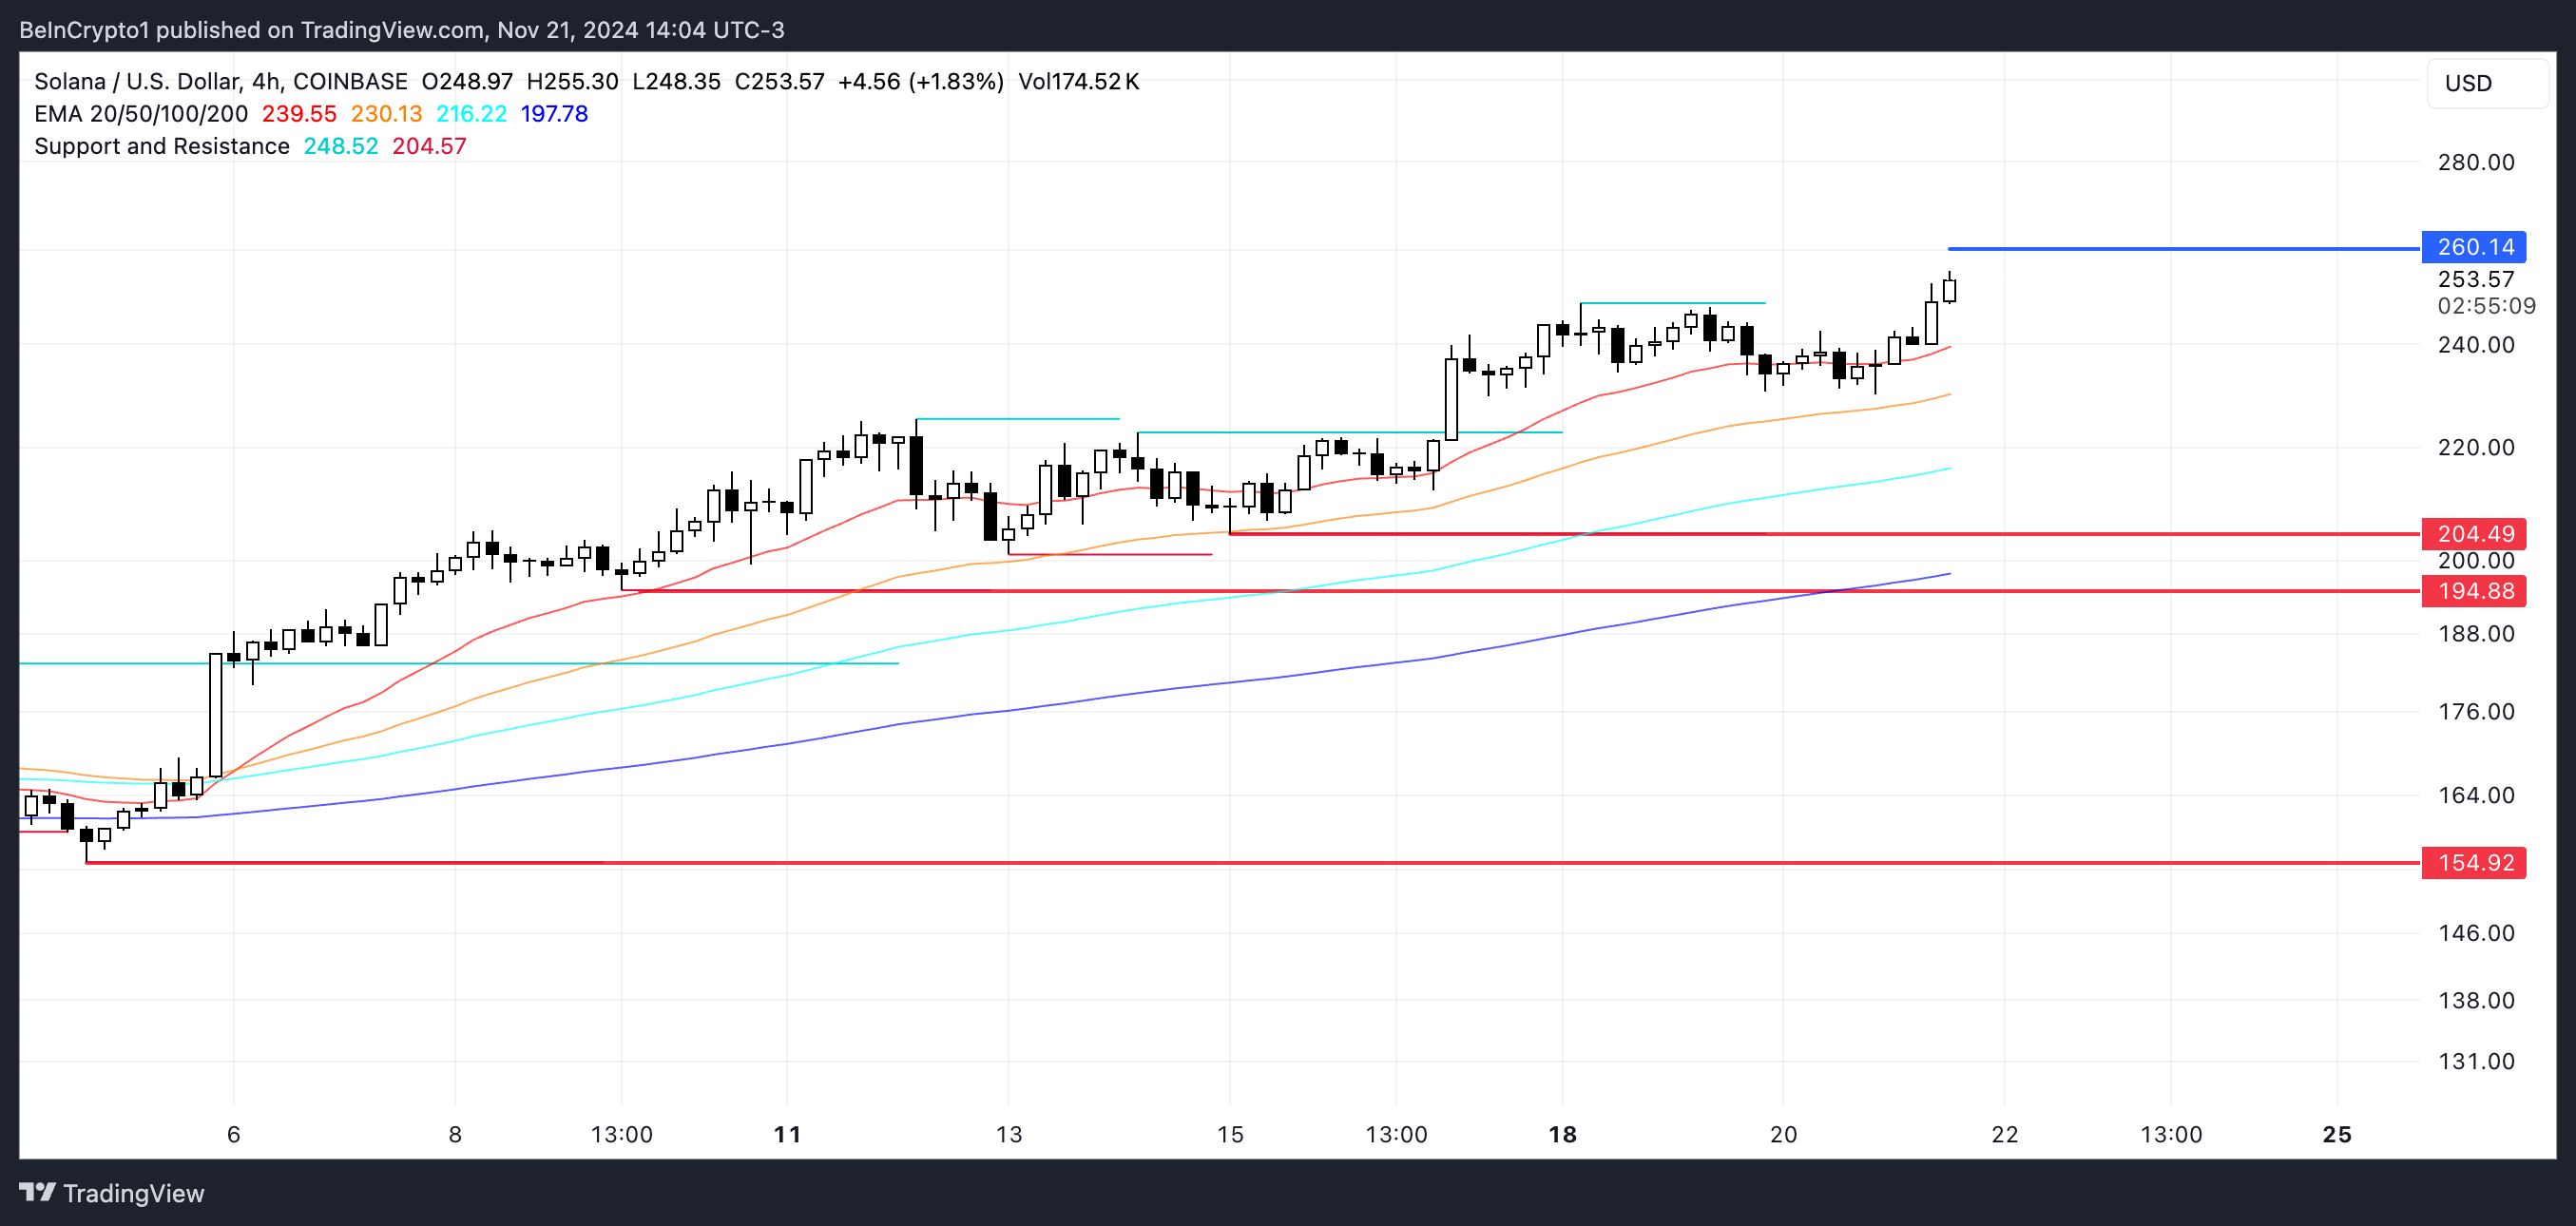
However, as indicated by BBTrend and ADX, the trend’s strength appears to be weakening, leaving room for a potential reversal. If a downtrend emerges, SOL price could test its support levels at $204 and $194.
Should these supports fail to hold, the price could drop further to $154, marking a significant correction from its current levels.
免責聲明:投資有風險,本文並非投資建議,以上內容不應被視為任何金融產品的購買或出售要約、建議或邀請,作者或其他用戶的任何相關討論、評論或帖子也不應被視為此類內容。本文僅供一般參考,不考慮您的個人投資目標、財務狀況或需求。TTM對信息的準確性和完整性不承擔任何責任或保證,投資者應自行研究並在投資前尋求專業建議。
熱議股票
- 1
- 2
- 3
- 4
- 5
- 6
- 7
- 8
- 9
- 10