Bitcoin Faces US Investor Cooldown Ahead of $90,000 Target
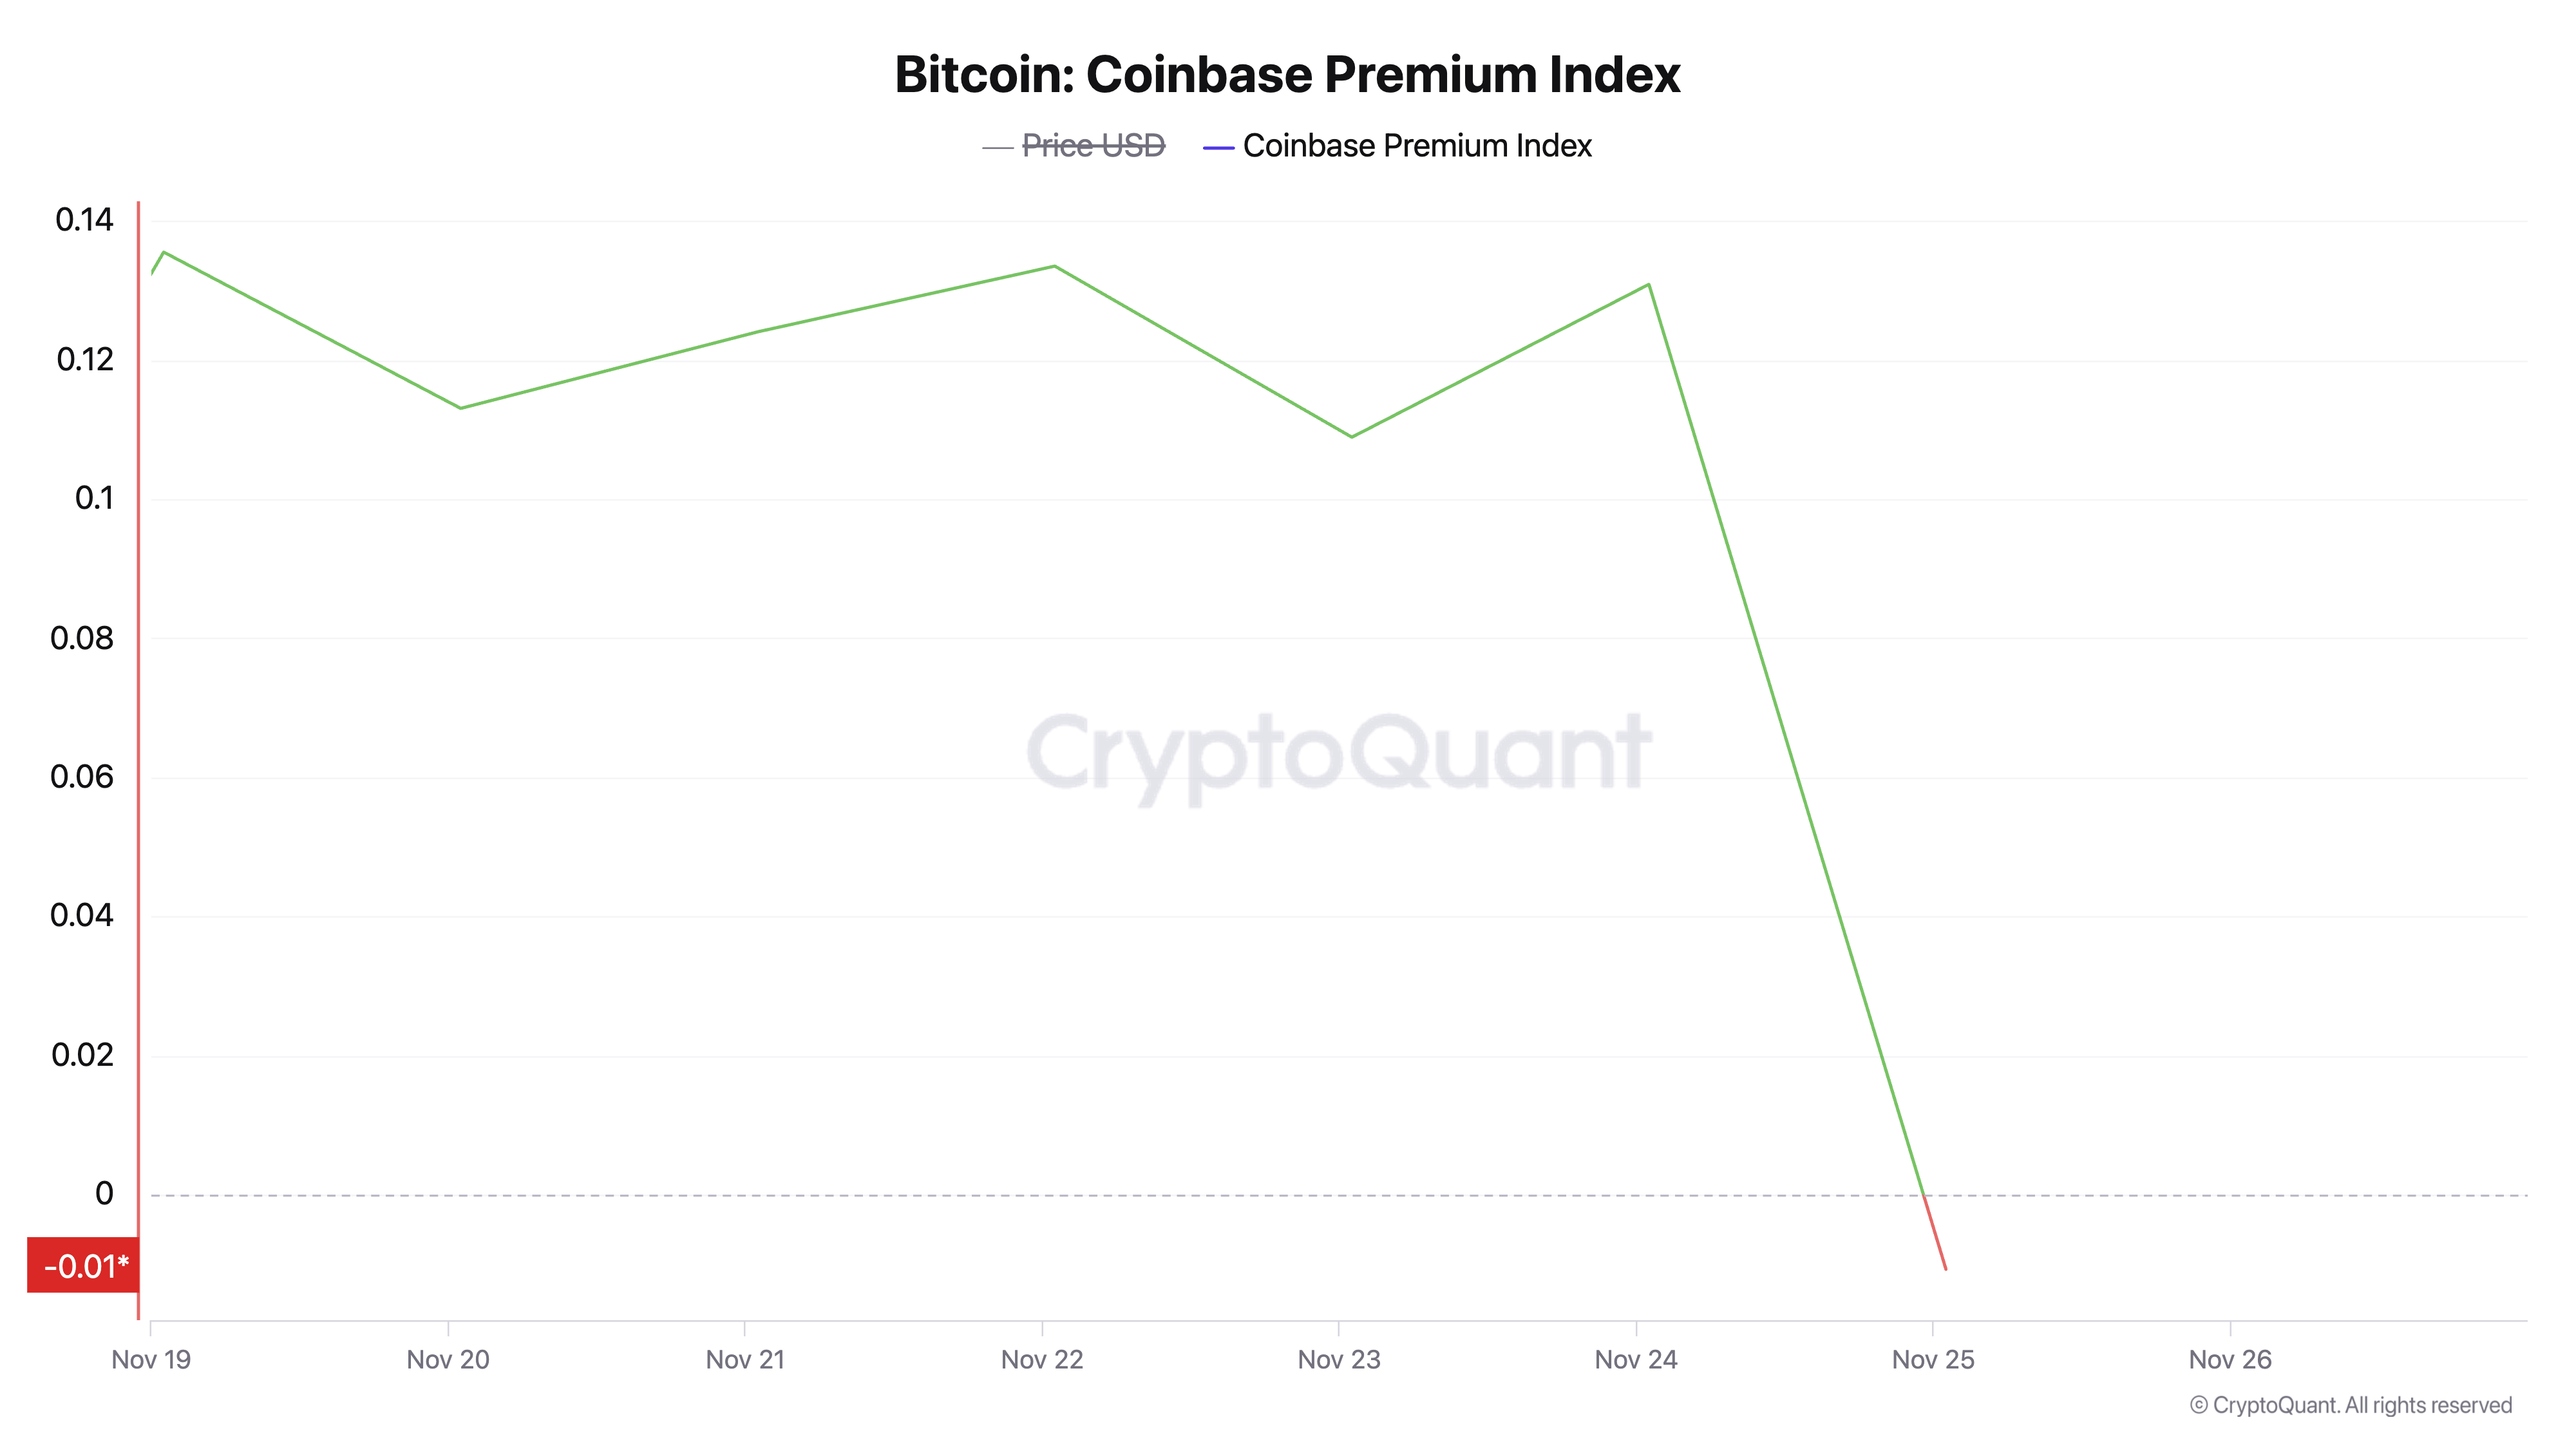
- Bitcoin’s price has dropped 6% over the past few days, with U.S. investors showing decreased demand, reflected in the Coinbase Premium Index.
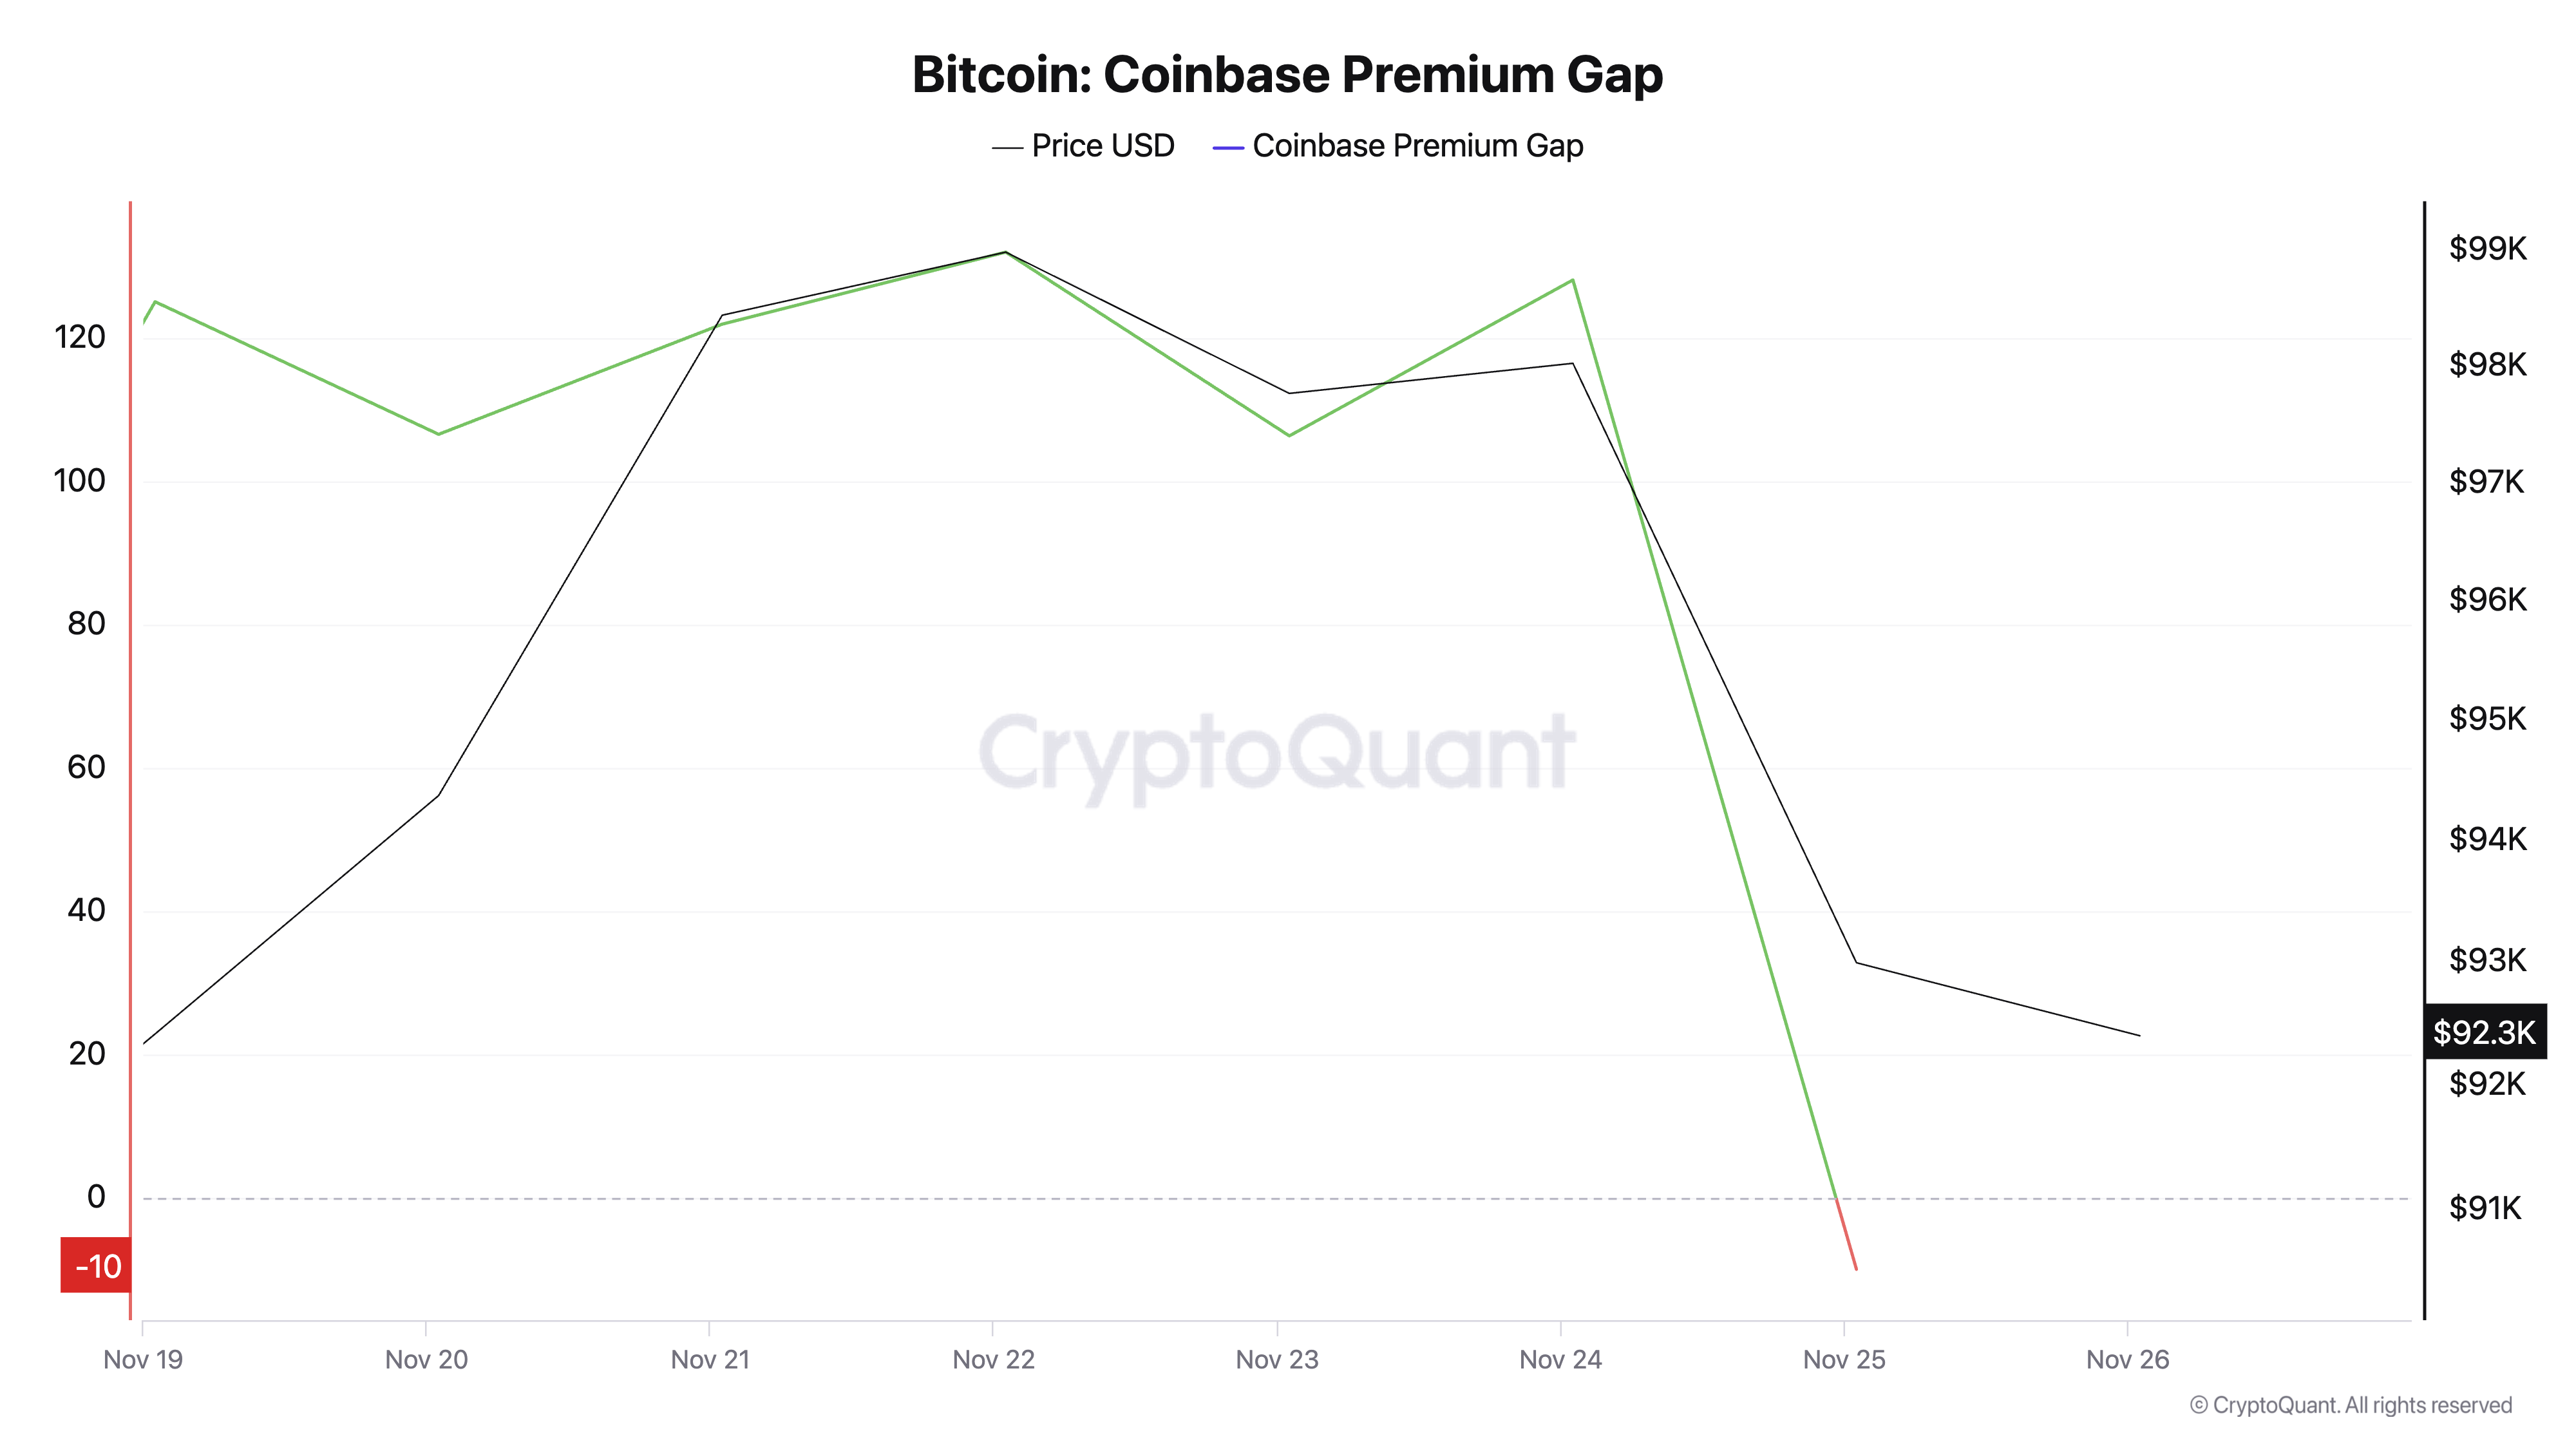
- The negative Coinbase Premium Gap signals weaker U.S. buying activity, while BTC's Parabolic SAR indicator shows signs of a downtrend.
- If Bitcoin's price falls below $88,630, it could drop to $80,159, but a market shift could push it back toward its all-time high of $99,419.
Bitcoin’s price decline over the past few days has led to a notable reduction in trading activity among US-based investors. As of this writing, the leading coin trades at $92,540, having shed 6% of its value in the past four days.
With strong resistance formed at the $99,000 price region, American investors have gradually reduced their coin holdings.
Bitcoin Holders in the US Shy Away
CryptoQuant’s data has shown a decline in BTC’s Coinbase Premium Index over the past seven days. As of this writing, it sits below the zero line and at a seven-day low of -0.01.
This metric measures the price difference of Bitcoin on Coinbase compared to Binance. It tracks the trading activity of institutional and US-based investors, as Coinbase is a preferred platform for these groups. A negative value indicates that the coin’s price on Coinbase is lower than on Binance, suggesting weaker demand or selling pressure from Bitcoin US investors.
Further, this trend of low buying activity among US investors is reflected in Bitcoin’s Coinbase Premium Gap. According to CryptoQuant, this metric has fallen to a seven-day low of -10.
It also measures the price difference between Bitcoin on Coinbase Pro (USD pair) and Binance (USDT pair). A positive gap indicates stronger buying pressure from Bitcoin US investors on Coinbase, suggesting increased demand. Conversely, a negative gap implies weaker demand from US investors.
BTC Price Prediction: Downward Trend May Persist
On BTC’s daily chart, the Parabolic Stop and Reverse (SAR) indicator now shows dots above the price, confirming a downtrend. This is the first time the dots have appeared in this position since November 6.
The SAR indicator tracks an asset’s price trend by plotting dots above or below the price. Dots below the price suggest an uptrend, while dots above the price signal a downtrend.
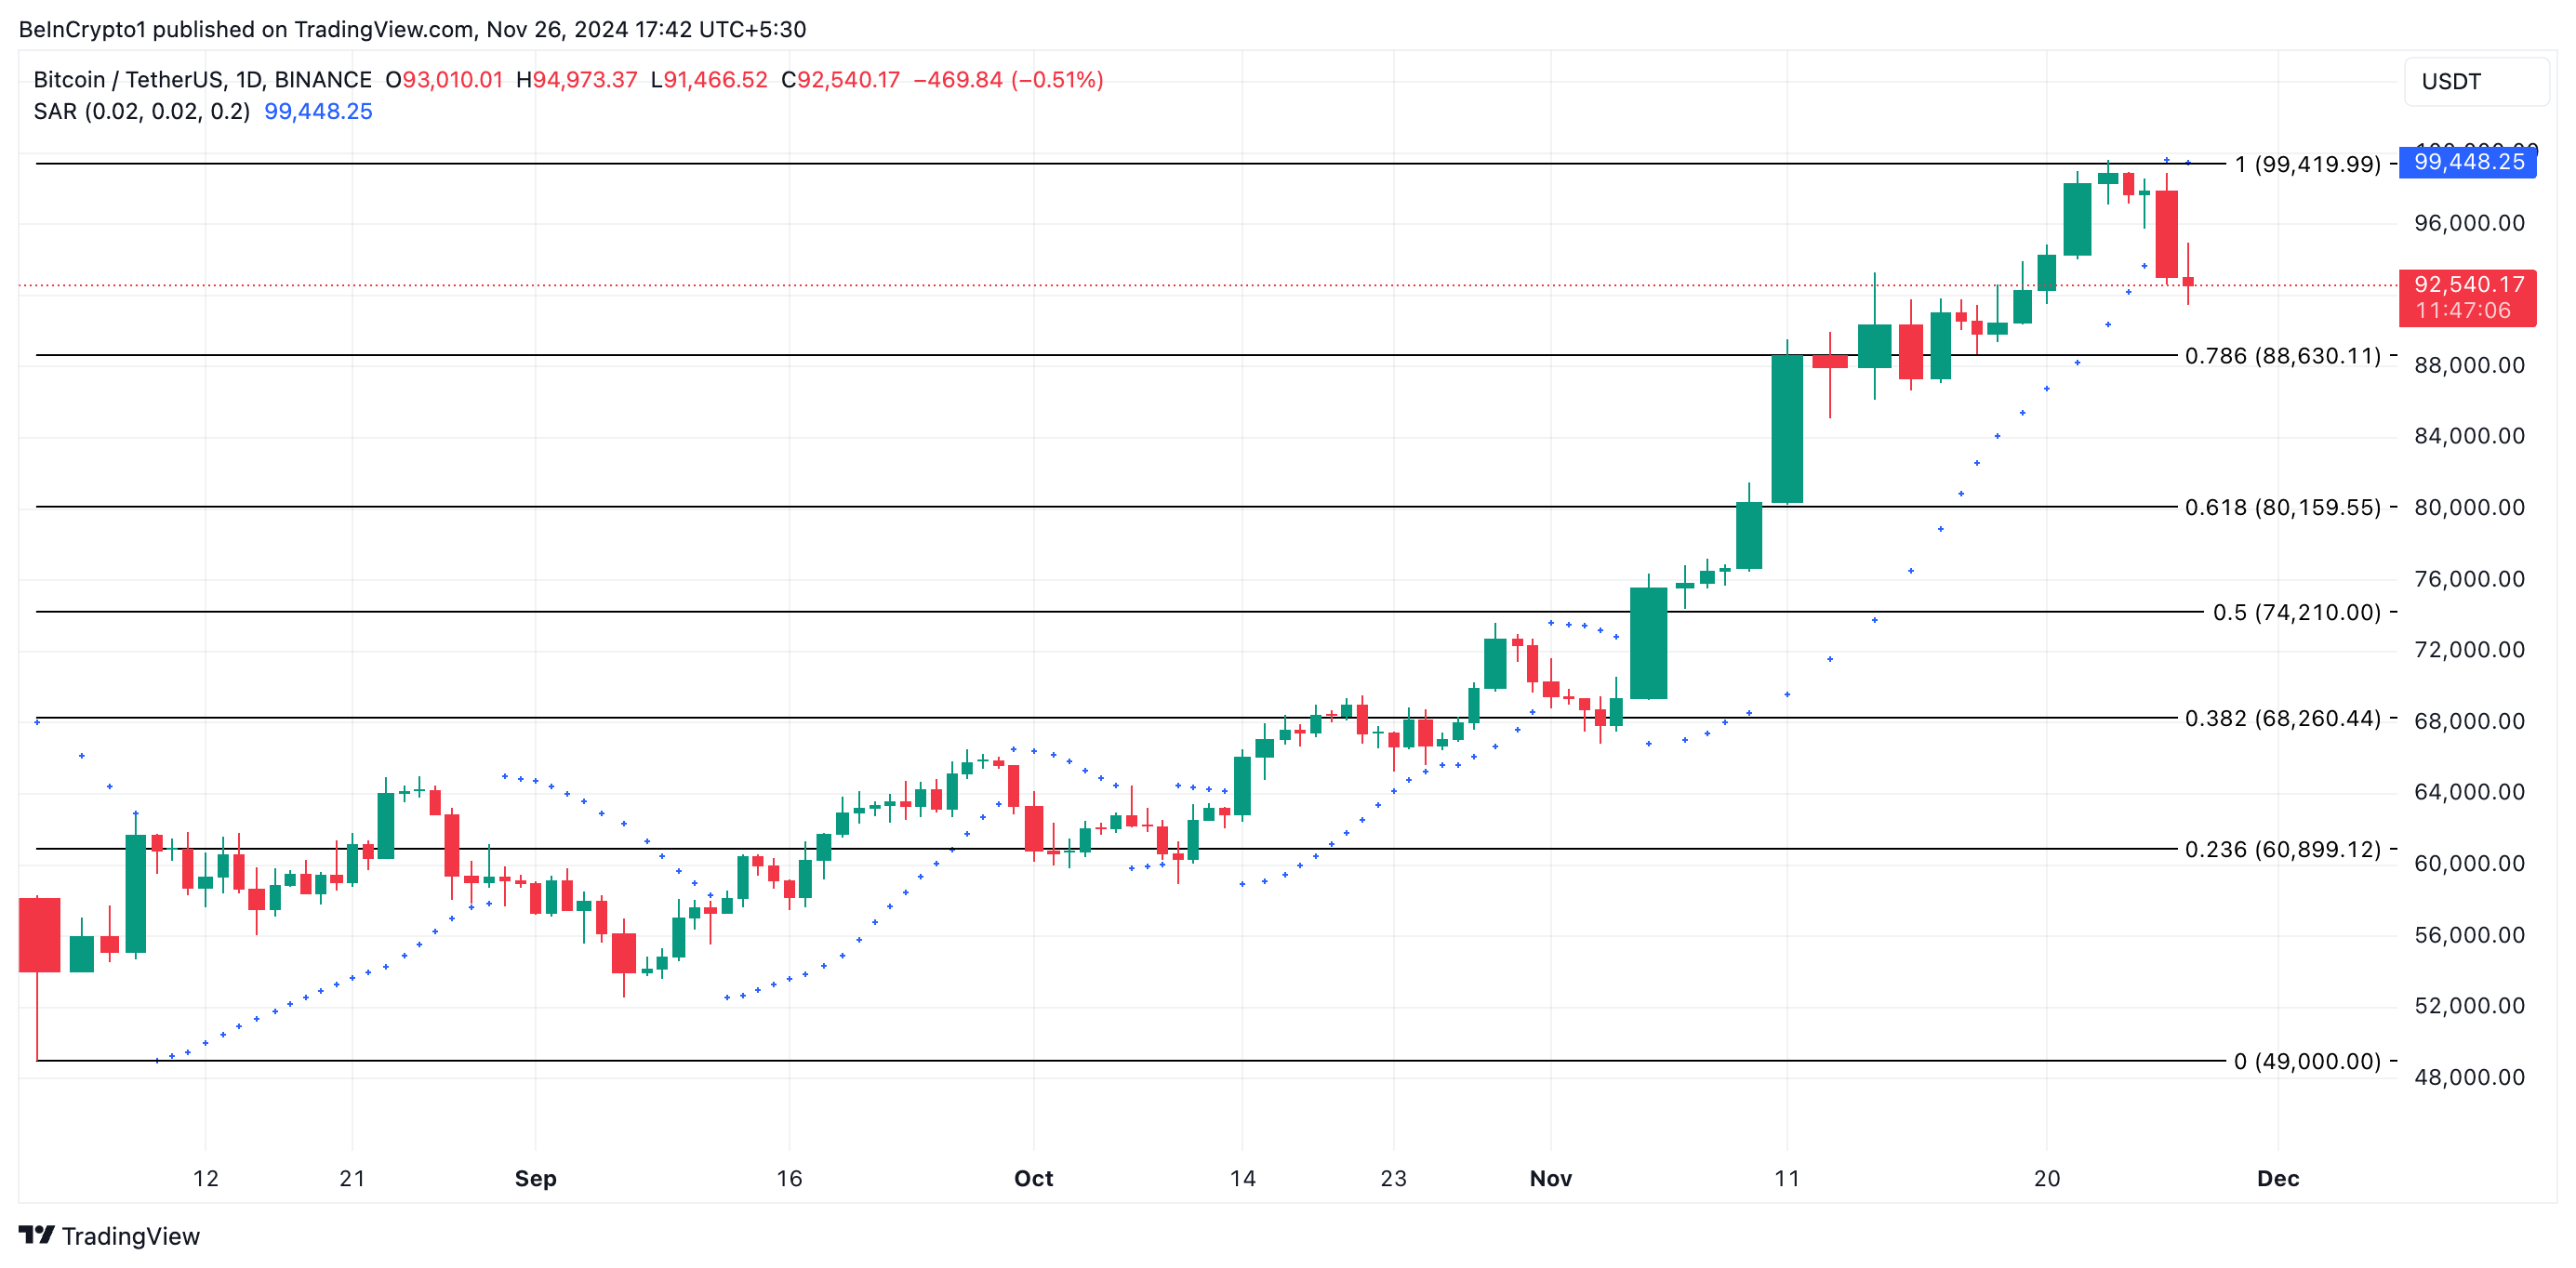
Bitcoin currently trades at $92,540, which is 4% shy of the support level, formed at $88,630. If the downward trend continues, the coin risks breaking below this support level and falling to $80,159.
However, if market sentiment shifts and buying activity resumes, BTC’s price may reclaim its all-time high of $99,419.
免責聲明:投資有風險,本文並非投資建議,以上內容不應被視為任何金融產品的購買或出售要約、建議或邀請,作者或其他用戶的任何相關討論、評論或帖子也不應被視為此類內容。本文僅供一般參考,不考慮您的個人投資目標、財務狀況或需求。TTM對信息的準確性和完整性不承擔任何責任或保證,投資者應自行研究並在投資前尋求專業建議。
熱議股票
- 1
- 2
- 3
- 4
- 5
- 6
- 7
- 8
- 9
- 10