Returns On Capital Signal Difficult Times Ahead For Kasen International Holdings (HKG:496)
If we're looking to avoid a business that is in decline, what are the trends that can warn us ahead of time? More often than not, we'll see a declining return on capital employed (ROCE) and a declining amount of capital employed. Ultimately this means that the company is earning less per dollar invested and on top of that, it's shrinking its base of capital employed. On that note, looking into Kasen International Holdings (HKG:496), we weren't too upbeat about how things were going.
Return On Capital Employed (ROCE): What Is It?
For those that aren't sure what ROCE is, it measures the amount of pre-tax profits a company can generate from the capital employed in its business. To calculate this metric for Kasen International Holdings, this is the formula:
Return on Capital Employed = Earnings Before Interest and Tax (EBIT) ÷ (Total Assets - Current Liabilities)
0.036 = CN¥158m ÷ (CN¥6.0b - CN¥1.7b) (Based on the trailing twelve months to June 2024).
Thus, Kasen International Holdings has an ROCE of 3.6%. Ultimately, that's a low return and it under-performs the Consumer Durables industry average of 12%.
Check out our latest analysis for Kasen International Holdings
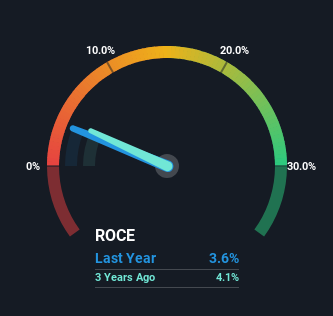
Historical performance is a great place to start when researching a stock so above you can see the gauge for Kasen International Holdings' ROCE against it's prior returns. If you'd like to look at how Kasen International Holdings has performed in the past in other metrics, you can view this free graph of Kasen International Holdings' past earnings, revenue and cash flow.
What Can We Tell From Kasen International Holdings' ROCE Trend?
There is reason to be cautious about Kasen International Holdings, given the returns are trending downwards. About five years ago, returns on capital were 23%, however they're now substantially lower than that as we saw above. And on the capital employed front, the business is utilizing roughly the same amount of capital as it was back then. Companies that exhibit these attributes tend to not be shrinking, but they can be mature and facing pressure on their margins from competition. So because these trends aren't typically conducive to creating a multi-bagger, we wouldn't hold our breath on Kasen International Holdings becoming one if things continue as they have.
On a side note, Kasen International Holdings has done well to pay down its current liabilities to 28% of total assets. So we could link some of this to the decrease in ROCE. What's more, this can reduce some aspects of risk to the business because now the company's suppliers or short-term creditors are funding less of its operations. Some would claim this reduces the business' efficiency at generating ROCE since it is now funding more of the operations with its own money.
The Key Takeaway
In summary, it's unfortunate that Kasen International Holdings is generating lower returns from the same amount of capital. This could explain why the stock has sunk a total of 91% in the last five years. That being the case, unless the underlying trends revert to a more positive trajectory, we'd consider looking elsewhere.
If you'd like to know more about Kasen International Holdings, we've spotted 2 warning signs, and 1 of them shouldn't be ignored.
While Kasen International Holdings isn't earning the highest return, check out this free list of companies that are earning high returns on equity with solid balance sheets.
Valuation is complex, but we're here to simplify it.
Discover if Kasen International Holdings might be undervalued or overvalued with our detailed analysis, featuring fair value estimates, potential risks, dividends, insider trades, and its financial condition.
Access Free AnalysisHave feedback on this article? Concerned about the content? Get in touch with us directly. Alternatively, email editorial-team (at) simplywallst.com.This article by Simply Wall St is general in nature. We provide commentary based on historical data and analyst forecasts only using an unbiased methodology and our articles are not intended to be financial advice. It does not constitute a recommendation to buy or sell any stock, and does not take account of your objectives, or your financial situation. We aim to bring you long-term focused analysis driven by fundamental data. Note that our analysis may not factor in the latest price-sensitive company announcements or qualitative material. Simply Wall St has no position in any stocks mentioned.
免責聲明:投資有風險,本文並非投資建議,以上內容不應被視為任何金融產品的購買或出售要約、建議或邀請,作者或其他用戶的任何相關討論、評論或帖子也不應被視為此類內容。本文僅供一般參考,不考慮您的個人投資目標、財務狀況或需求。TTM對信息的準確性和完整性不承擔任何責任或保證,投資者應自行研究並在投資前尋求專業建議。
熱議股票
- 1
- 2
- 3
- 4
- 5
- 6
- 7
- 8
- 9
- 10