Investors Still Aren't Entirely Convinced By Chuanglian Holdings Limited's (HKG:2371) Revenues Despite 26% Price Jump
Despite an already strong run, Chuanglian Holdings Limited (HKG:2371) shares have been powering on, with a gain of 26% in the last thirty days. Notwithstanding the latest gain, the annual share price return of 9.1% isn't as impressive.
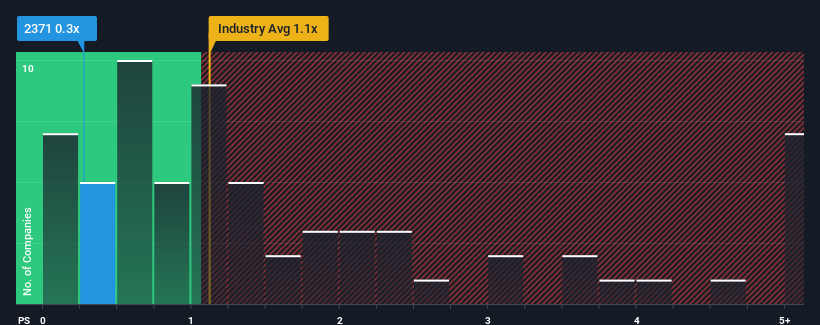
In spite of the firm bounce in price, it would still be understandable if you think Chuanglian Holdings is a stock with good investment prospects with a price-to-sales ratios (or "P/S") of 0.3x, considering almost half the companies in Hong Kong's Consumer Services industry have P/S ratios above 1.1x. Although, it's not wise to just take the P/S at face value as there may be an explanation why it's limited.
View our latest analysis for Chuanglian Holdings
How Chuanglian Holdings Has Been Performing
Recent times have been quite advantageous for Chuanglian Holdings as its revenue has been rising very briskly. Perhaps the market is expecting future revenue performance to dwindle, which has kept the P/S suppressed. Those who are bullish on Chuanglian Holdings will be hoping that this isn't the case, so that they can pick up the stock at a lower valuation.
Want the full picture on earnings, revenue and cash flow for the company? Then our free report on Chuanglian Holdings will help you shine a light on its historical performance.What Are Revenue Growth Metrics Telling Us About The Low P/S?
Chuanglian Holdings' P/S ratio would be typical for a company that's only expected to deliver limited growth, and importantly, perform worse than the industry.
Taking a look back first, we see that the company grew revenue by an impressive 49% last year. The strong recent performance means it was also able to grow revenue by 160% in total over the last three years. Therefore, it's fair to say the revenue growth recently has been superb for the company.
When compared to the industry's one-year growth forecast of 20%, the most recent medium-term revenue trajectory is noticeably more alluring
With this information, we find it odd that Chuanglian Holdings is trading at a P/S lower than the industry. It looks like most investors are not convinced the company can maintain its recent growth rates.
What Does Chuanglian Holdings' P/S Mean For Investors?
The latest share price surge wasn't enough to lift Chuanglian Holdings' P/S close to the industry median. Typically, we'd caution against reading too much into price-to-sales ratios when settling on investment decisions, though it can reveal plenty about what other market participants think about the company.
We're very surprised to see Chuanglian Holdings currently trading on a much lower than expected P/S since its recent three-year growth is higher than the wider industry forecast. When we see strong revenue with faster-than-industry growth, we assume there are some significant underlying risks to the company's ability to make money which is applying downwards pressure on the P/S ratio. While recent revenue trends over the past medium-term suggest that the risk of a price decline is low, investors appear to perceive a likelihood of revenue fluctuations in the future.
You should always think about risks. Case in point, we've spotted 3 warning signs for Chuanglian Holdings you should be aware of, and 2 of them are significant.
Of course, profitable companies with a history of great earnings growth are generally safer bets. So you may wish to see this free collection of other companies that have reasonable P/E ratios and have grown earnings strongly.
New: AI Stock Screener & Alerts
Our new AI Stock Screener scans the market every day to uncover opportunities.
• Dividend Powerhouses (3%+ Yield)• Undervalued Small Caps with Insider Buying• High growth Tech and AI CompaniesOr build your own from over 50 metrics.
Explore Now for FreeHave feedback on this article? Concerned about the content? Get in touch with us directly. Alternatively, email editorial-team (at) simplywallst.com.This article by Simply Wall St is general in nature. We provide commentary based on historical data and analyst forecasts only using an unbiased methodology and our articles are not intended to be financial advice. It does not constitute a recommendation to buy or sell any stock, and does not take account of your objectives, or your financial situation. We aim to bring you long-term focused analysis driven by fundamental data. Note that our analysis may not factor in the latest price-sensitive company announcements or qualitative material. Simply Wall St has no position in any stocks mentioned.
免責聲明:投資有風險,本文並非投資建議,以上內容不應被視為任何金融產品的購買或出售要約、建議或邀請,作者或其他用戶的任何相關討論、評論或帖子也不應被視為此類內容。本文僅供一般參考,不考慮您的個人投資目標、財務狀況或需求。TTM對信息的準確性和完整性不承擔任何責任或保證,投資者應自行研究並在投資前尋求專業建議。
熱議股票
- 1
- 2
- 3
- 4
- 5
- 6
- 7
- 8
- 9
- 10