We Like These Underlying Return On Capital Trends At Telstra Group (ASX:TLS)
To find a multi-bagger stock, what are the underlying trends we should look for in a business? In a perfect world, we'd like to see a company investing more capital into its business and ideally the returns earned from that capital are also increasing. If you see this, it typically means it's a company with a great business model and plenty of profitable reinvestment opportunities. With that in mind, we've noticed some promising trends at Telstra Group (ASX:TLS) so let's look a bit deeper.
What Is Return On Capital Employed (ROCE)?
For those who don't know, ROCE is a measure of a company's yearly pre-tax profit (its return), relative to the capital employed in the business. To calculate this metric for Telstra Group, this is the formula:
Return on Capital Employed = Earnings Before Interest and Tax (EBIT) ÷ (Total Assets - Current Liabilities)
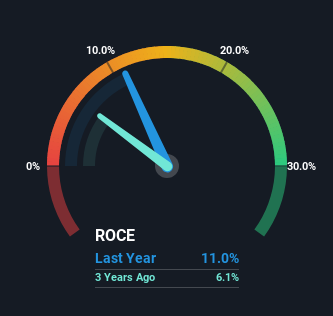
0.11 = AU$3.7b ÷ (AU$46b - AU$12b) (Based on the trailing twelve months to June 2024).
So, Telstra Group has an ROCE of 11%. That's a relatively normal return on capital, and it's around the 10% generated by the Telecom industry.
See our latest analysis for Telstra Group
Above you can see how the current ROCE for Telstra Group compares to its prior returns on capital, but there's only so much you can tell from the past. If you'd like, you can check out the forecasts from the analysts covering Telstra Group for free.
What Does the ROCE Trend For Telstra Group Tell Us?
Telstra Group has not disappointed with their ROCE growth. More specifically, while the company has kept capital employed relatively flat over the last five years, the ROCE has climbed 35% in that same time. So it's likely that the business is now reaping the full benefits of its past investments, since the capital employed hasn't changed considerably. The company is doing well in that sense, and it's worth investigating what the management team has planned for long term growth prospects.
The Bottom Line
In summary, we're delighted to see that Telstra Group has been able to increase efficiencies and earn higher rates of return on the same amount of capital. Investors may not be impressed by the favorable underlying trends yet because over the last five years the stock has only returned 35% to shareholders. So exploring more about this stock could uncover a good opportunity, if the valuation and other metrics stack up.
One more thing: We've identified 3 warning signs with Telstra Group (at least 1 which is a bit unpleasant) , and understanding them would certainly be useful.
While Telstra Group may not currently earn the highest returns, we've compiled a list of companies that currently earn more than 25% return on equity. Check out this free list here.
Valuation is complex, but we're here to simplify it.
Discover if Telstra Group might be undervalued or overvalued with our detailed analysis, featuring fair value estimates, potential risks, dividends, insider trades, and its financial condition.
Access Free AnalysisHave feedback on this article? Concerned about the content? Get in touch with us directly. Alternatively, email editorial-team (at) simplywallst.com.This article by Simply Wall St is general in nature. We provide commentary based on historical data and analyst forecasts only using an unbiased methodology and our articles are not intended to be financial advice. It does not constitute a recommendation to buy or sell any stock, and does not take account of your objectives, or your financial situation. We aim to bring you long-term focused analysis driven by fundamental data. Note that our analysis may not factor in the latest price-sensitive company announcements or qualitative material. Simply Wall St has no position in any stocks mentioned.
免責聲明:投資有風險,本文並非投資建議,以上內容不應被視為任何金融產品的購買或出售要約、建議或邀請,作者或其他用戶的任何相關討論、評論或帖子也不應被視為此類內容。本文僅供一般參考,不考慮您的個人投資目標、財務狀況或需求。TTM對信息的準確性和完整性不承擔任何責任或保證,投資者應自行研究並在投資前尋求專業建議。
熱議股票
- 1
- 2
- 3
- 4
- 5
- 6
- 7
- 8
- 9
- 10