Solana (SOL) Struggles to Hold Gains After Reaching New ATH
- Solana (SOL) dropped 10% in 24 hours as indicators like BBTrend and DMI show increasing selling pressure.
- Key supports at $204 and $194 may be tested if bearish trends persist, with a potential death cross signaling further declines.
- If SOL regains momentum, it could challenge resistance at $248, with a chance to revisit its $264 all-time high.
Solana (SOL) price reached an all-time high of $264 on November 22 but has since entered a correction, dropping nearly 10% in the past 24 hours. Indicators like BBTrend and DMI show increasing bearish momentum.
The EMA lines, while still showing a bullish structure, hint at a potential death cross, which could intensify the correction if it forms. As SOL approaches key support levels, its ability to recover bullish momentum will determine whether it revisits resistance at $248 or faces further declines toward $194.
SOL BBTrend Is Negative for the First Time in 8 Days
Solana BBTrend has turned negative for the first time since November 18, currently sitting at -0.54. The BBTrend, or Bollinger Bands Trend, measures the momentum and direction of price movement relative to the Bollinger Bands, with positive values indicating upward trends and negative values suggesting downward trends.
This shift to negative territory signals increasing bearish momentum, marking a stark contrast from its recent peak of 10.8 on November 20, just before SOL reached a new all-time high.
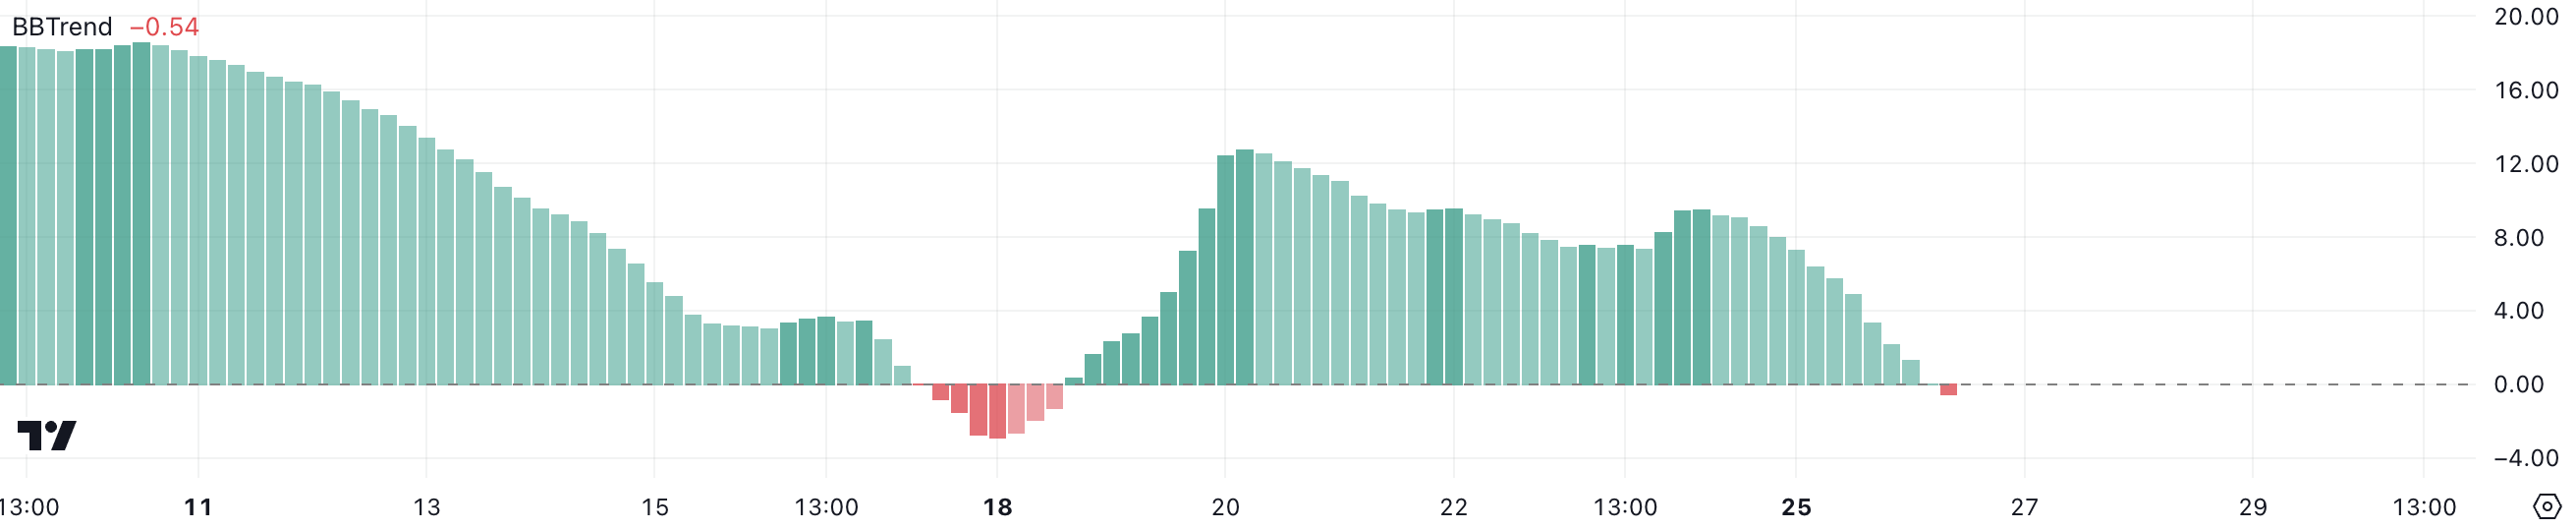
Although -0.54 might not seem significant, it reflects a clear change in market sentiment, with SOL now down nearly 10% in the last 24 hours.
If the BBTrend continues to decline, it could amplify the bearish pressure, pushing SOL into a deeper downtrend. This would likely lead to further price corrections as sellers dominate and the market loses confidence in its short-term recovery potential.
Solana Downtrend Is Getting Stronger
SOL DMI chart shows its ADX rising to 27.24 from 21 yesterday, signaling a strengthening trend momentum. The ADX, or Average Directional Index, measures the strength of a trend, with values above 25 indicating a significant trend, whether bullish or bearish.
In Solana’s case, the rising ADX reflects increasing momentum in its current downtrend, suggesting that selling pressure is intensifying.
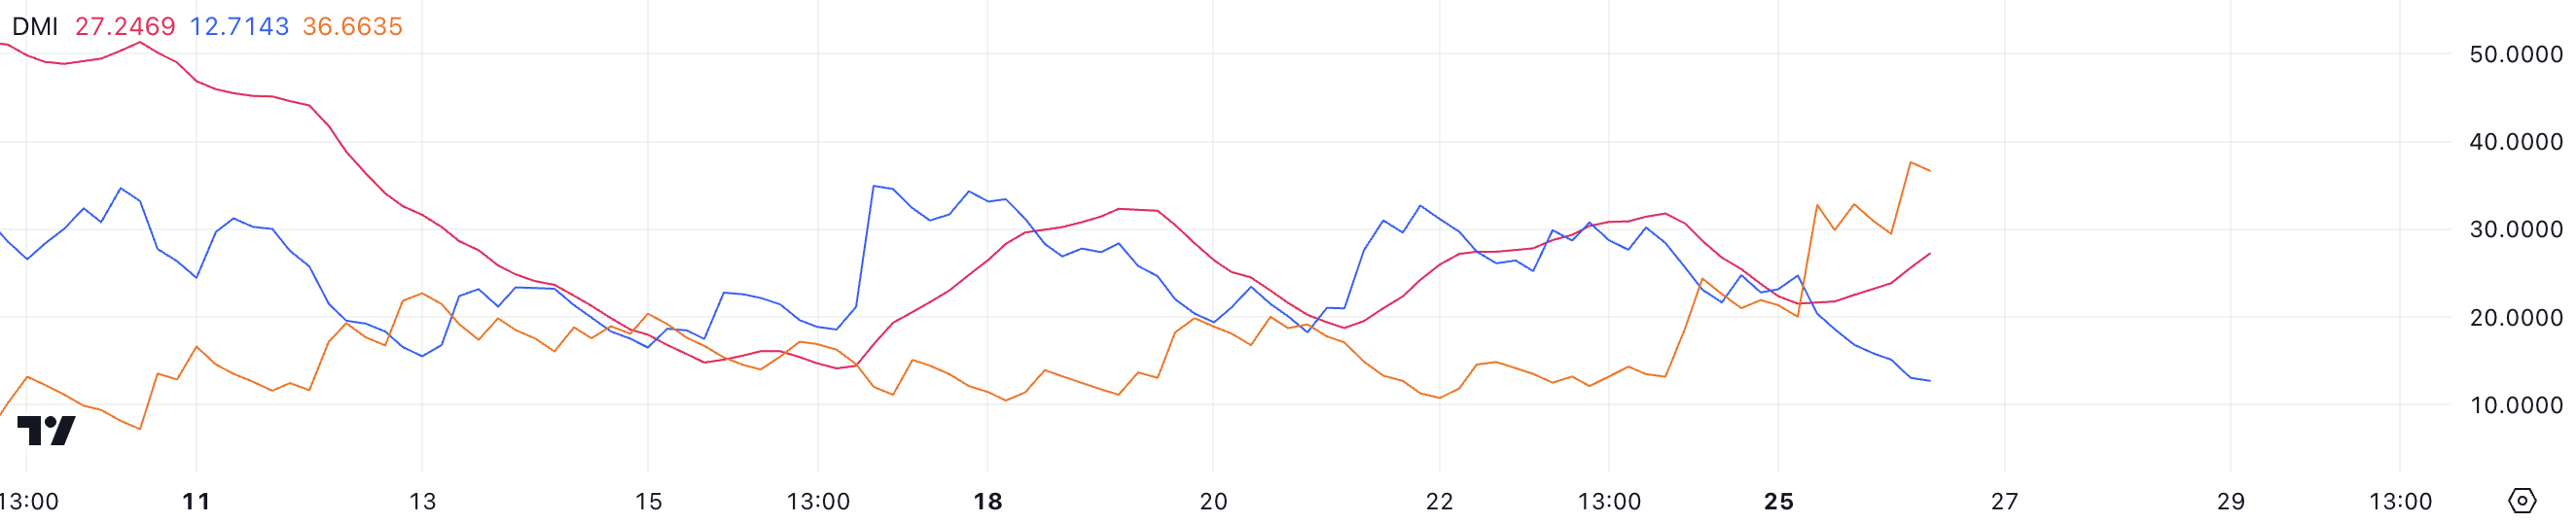
The DMI indicators further reinforce this bearish sentiment, with D+ at 12.7 and D- at 36.6. This large gap shows that bearish forces (D-) significantly outweigh bullish ones (D+).
An ADX above 25 and growing in a downtrend indicates that the negative momentum is solidifying. If this trend continues, Solana price could see further declines as the market tilts heavily in favor of sellers.
SOL Price Prediction: No New All-Time Highs For Now?
SOL EMA lines present a pivotal scenario, with the short-term lines still positioned above the long-term ones, indicating a lingering bullish setup.
However, the shortest-term EMA lines are trending downward and nearing a potential crossover with longer-term lines, signaling the possible formation of a death cross. This pattern often indicates a shift from bullish to bearish momentum, raising caution among traders.
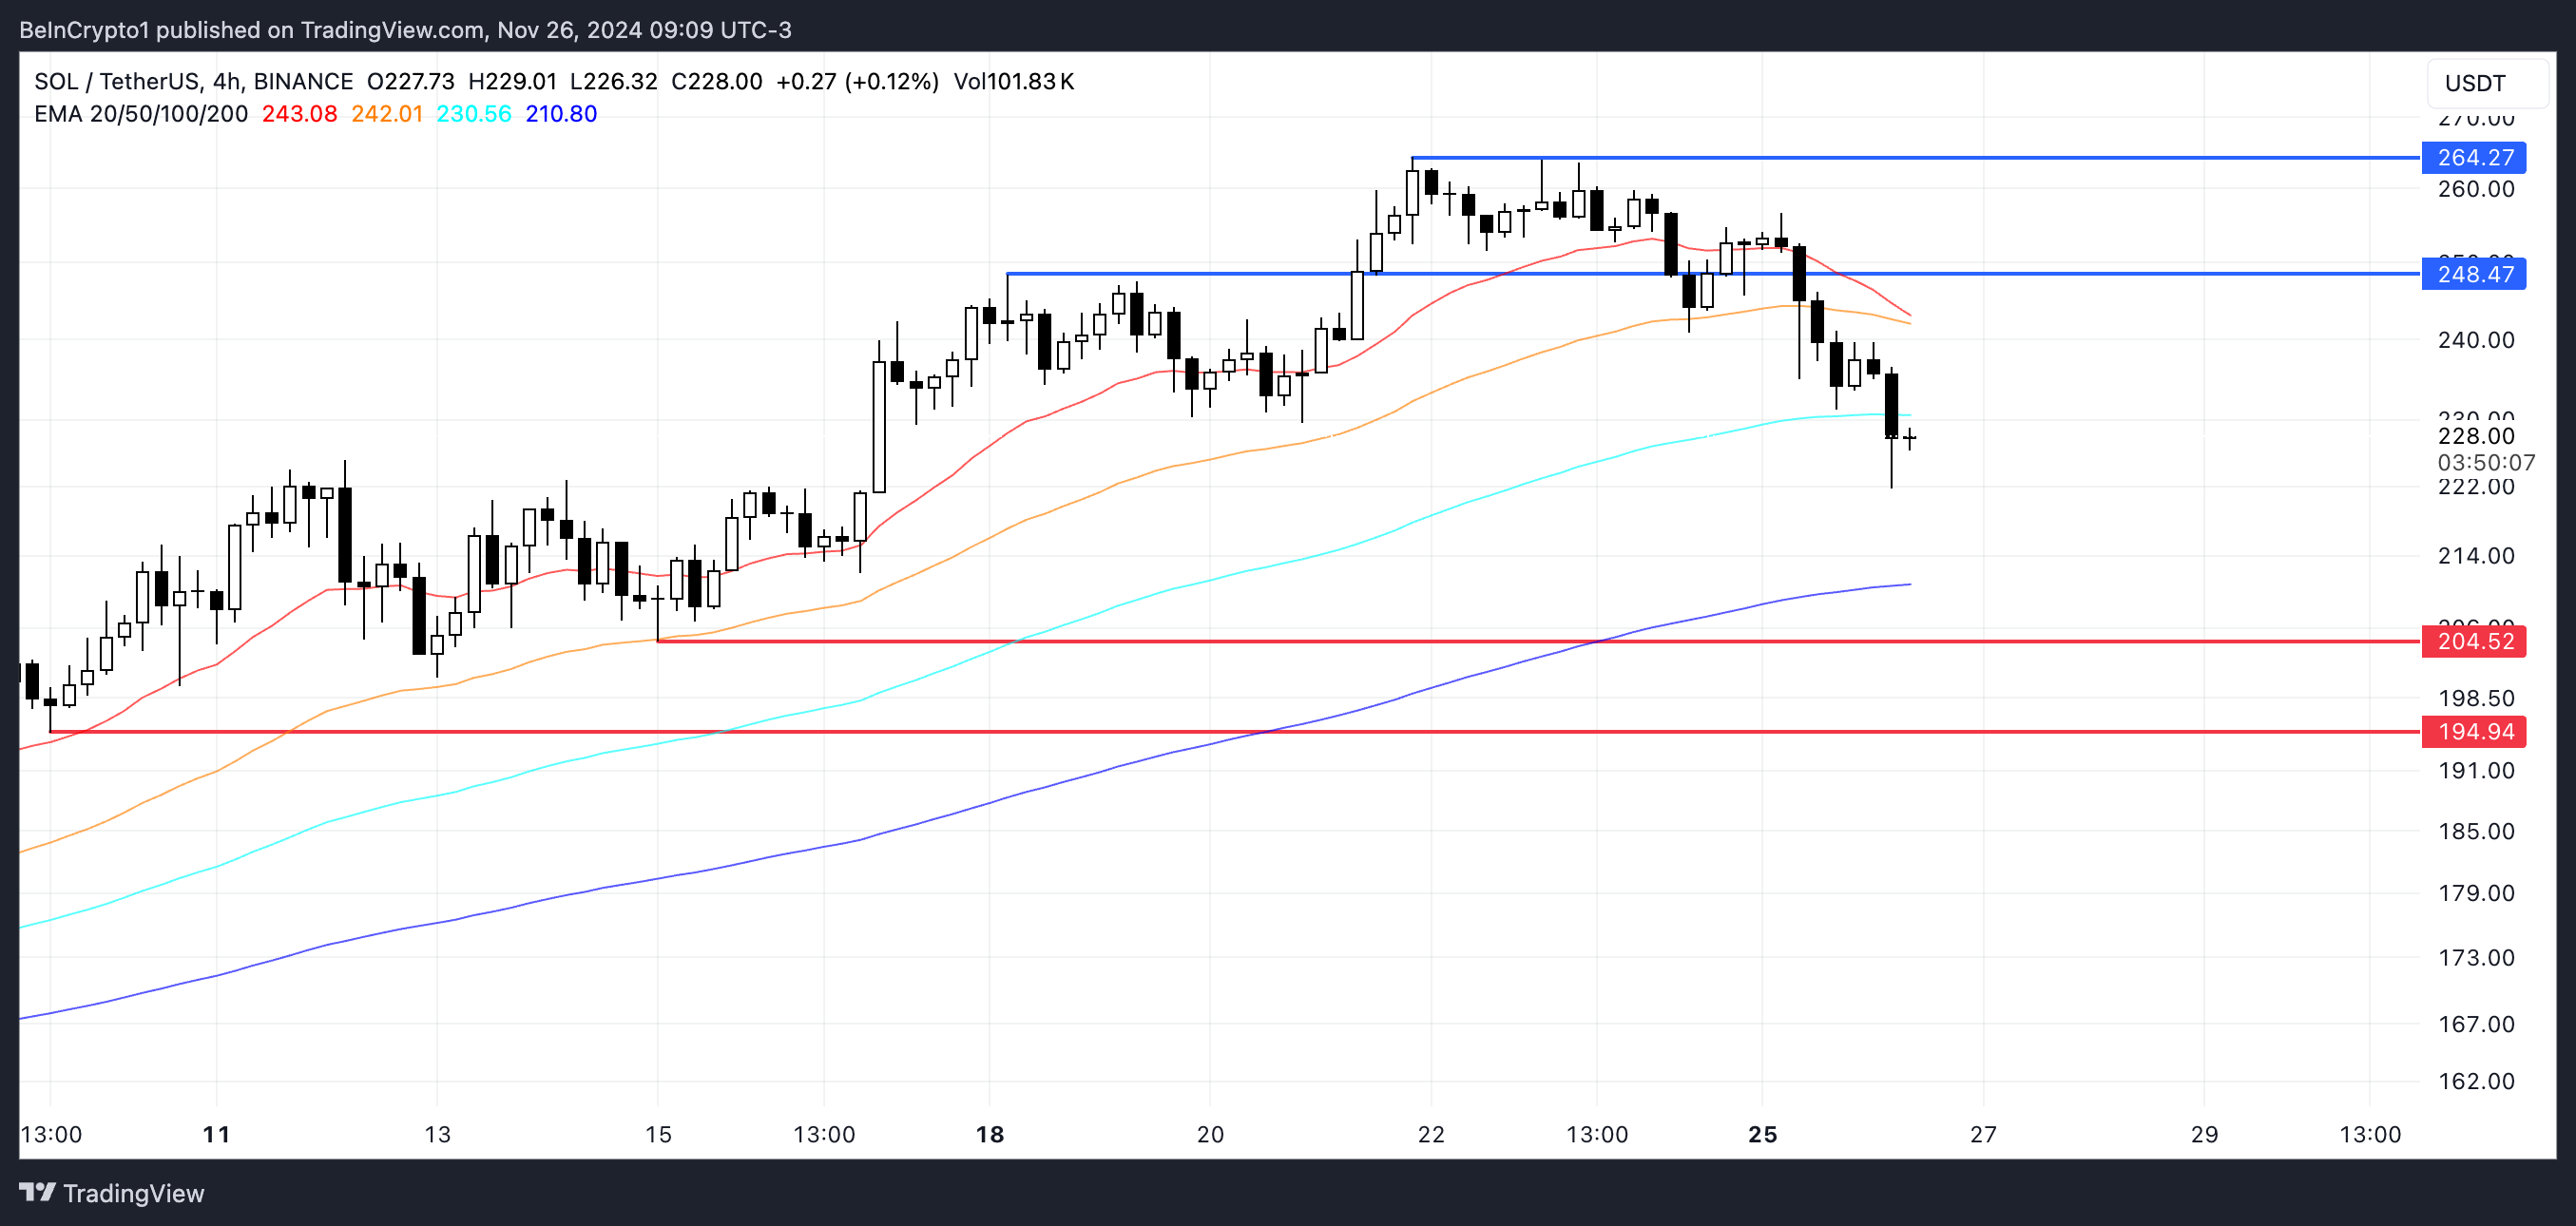
If a death cross forms, SOL’s correction could intensify, leading the price to test its nearest support at $204. Should this level fail to hold, SOL price could decline further, targeting $194.
On the other hand, if Solana regains bullish momentum and reverses the trend, it could challenge resistance at $248. Breaking above this level could propel SOL price to surpass $264, achieving a new all-time high and reinforcing bullish sentiment in the market.
免責聲明:投資有風險,本文並非投資建議,以上內容不應被視為任何金融產品的購買或出售要約、建議或邀請,作者或其他用戶的任何相關討論、評論或帖子也不應被視為此類內容。本文僅供一般參考,不考慮您的個人投資目標、財務狀況或需求。TTM對信息的準確性和完整性不承擔任何責任或保證,投資者應自行研究並在投資前尋求專業建議。
熱議股票
- 1
- 2
- 3
- 4
- 5
- 6
- 7
- 8
- 9
- 10