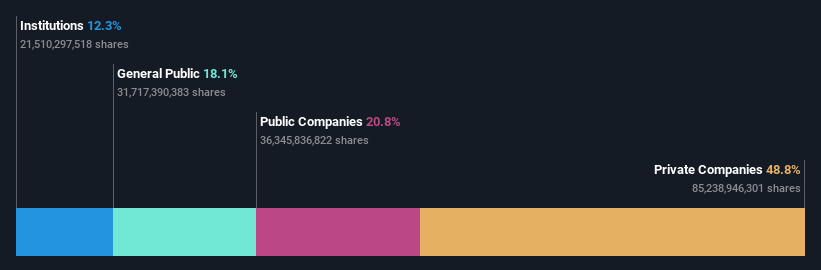
Public companies own 21% of China Tower Corporation Limited (HKG:788) shares but private companies control 49% of the company
Key Insights
- China Tower's significant private companies ownership suggests that the key decisions are influenced by shareholders from the larger public
- 70% of the business is held by the top 3 shareholders
- Institutions own 12% of China Tower
If you want to know who really controls China Tower Corporation Limited (HKG:788), then you'll have to look at the makeup of its share registry. We can see that private companies own the lion's share in the company with 49% ownership. That is, the group stands to benefit the most if the stock rises (or lose the most if there is a downturn).
Meanwhile, public companies make up 21% of the company’s shareholders.
In the chart below, we zoom in on the different ownership groups of China Tower.
Check out our latest analysis for China Tower
What Does The Institutional Ownership Tell Us About China Tower?
Institutional investors commonly compare their own returns to the returns of a commonly followed index. So they generally do consider buying larger companies that are included in the relevant benchmark index.
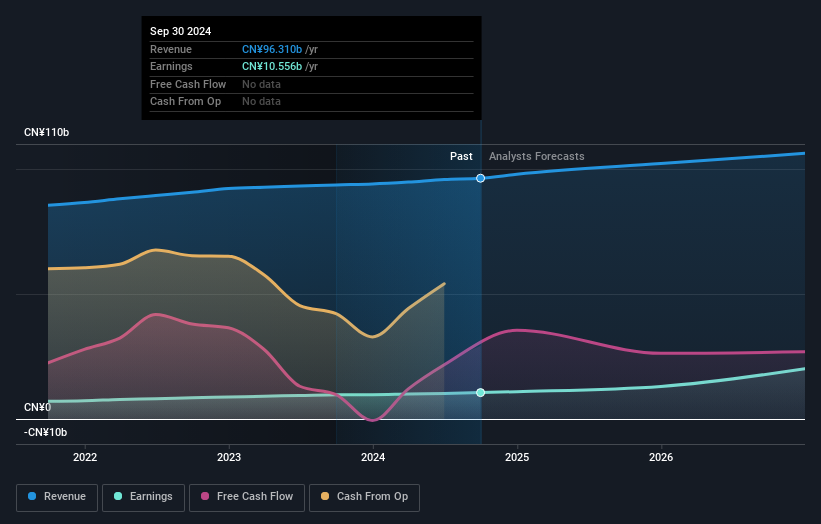
We can see that China Tower does have institutional investors; and they hold a good portion of the company's stock. This implies the analysts working for those institutions have looked at the stock and they like it. But just like anyone else, they could be wrong. It is not uncommon to see a big share price drop if two large institutional investors try to sell out of a stock at the same time. So it is worth checking the past earnings trajectory of China Tower, (below). Of course, keep in mind that there are other factors to consider, too.
China Tower is not owned by hedge funds. Looking at our data, we can see that the largest shareholder is China Mobile Communications Group Co., Ltd. with 28% of shares outstanding. The second and third largest shareholders are China United Network Communications Limited and China Telecom Group Co., Ltd., with an equal amount of shares to their name at 21%.
To make our study more interesting, we found that the top 3 shareholders have a majority ownership in the company, meaning that they are powerful enough to influence the decisions of the company.
While it makes sense to study institutional ownership data for a company, it also makes sense to study analyst sentiments to know which way the wind is blowing. There are plenty of analysts covering the stock, so it might be worth seeing what they are forecasting, too.
Insider Ownership Of China Tower
The definition of company insiders can be subjective and does vary between jurisdictions. Our data reflects individual insiders, capturing board members at the very least. Management ultimately answers to the board. However, it is not uncommon for managers to be executive board members, especially if they are a founder or the CEO.
Most consider insider ownership a positive because it can indicate the board is well aligned with other shareholders. However, on some occasions too much power is concentrated within this group.
We note our data does not show any board members holding shares, personally. It is rare to see such a low level of personal ownership, amongst the board (and it is possible that our data might be incomplete). Concerned investors should check here to see if insiders have been selling or buying.
General Public Ownership
The general public, who are usually individual investors, hold a 18% stake in China Tower. While this group can't necessarily call the shots, it can certainly have a real influence on how the company is run.
Private Company Ownership
Our data indicates that Private Companies hold 49%, of the company's shares. It's hard to draw any conclusions from this fact alone, so its worth looking into who owns those private companies. Sometimes insiders or other related parties have an interest in shares in a public company through a separate private company.
Public Company Ownership
Public companies currently own 21% of China Tower stock. It's hard to say for sure but this suggests they have entwined business interests. This might be a strategic stake, so it's worth watching this space for changes in ownership.
Next Steps:
While it is well worth considering the different groups that own a company, there are other factors that are even more important. For example, we've discovered 1 warning sign for China Tower that you should be aware of before investing here.
If you are like me, you may want to think about whether this company will grow or shrink. Luckily, you can check this free report showing analyst forecasts for its future.
NB: Figures in this article are calculated using data from the last twelve months, which refer to the 12-month period ending on the last date of the month the financial statement is dated. This may not be consistent with full year annual report figures.
New: AI Stock Screener & Alerts
Our new AI Stock Screener scans the market every day to uncover opportunities.
• Dividend Powerhouses (3%+ Yield)• Undervalued Small Caps with Insider Buying• High growth Tech and AI CompaniesOr build your own from over 50 metrics.
Explore Now for FreeHave feedback on this article? Concerned about the content? Get in touch with us directly. Alternatively, email editorial-team (at) simplywallst.com.This article by Simply Wall St is general in nature. We provide commentary based on historical data and analyst forecasts only using an unbiased methodology and our articles are not intended to be financial advice. It does not constitute a recommendation to buy or sell any stock, and does not take account of your objectives, or your financial situation. We aim to bring you long-term focused analysis driven by fundamental data. Note that our analysis may not factor in the latest price-sensitive company announcements or qualitative material. Simply Wall St has no position in any stocks mentioned.
免責聲明:投資有風險,本文並非投資建議,以上內容不應被視為任何金融產品的購買或出售要約、建議或邀請,作者或其他用戶的任何相關討論、評論或帖子也不應被視為此類內容。本文僅供一般參考,不考慮您的個人投資目標、財務狀況或需求。TTM對信息的準確性和完整性不承擔任何責任或保證,投資者應自行研究並在投資前尋求專業建議。
熱議股票
- 1
- 2
- 3
- 4
- 5
- 6
- 7
- 8
- 9
- 10