3 Stocks That May Be Trading Below Their Estimated Intrinsic Values
As global markets experience broad-based gains with U.S. indexes approaching record highs, investors are navigating a landscape marked by geopolitical tensions and economic policy shifts. Amidst this environment, identifying stocks trading below their estimated intrinsic values can offer potential opportunities for those seeking to capitalize on market inefficiencies.
Top 10 Undervalued Stocks Based On Cash Flows
| Name | Current Price | Fair Value (Est) | Discount (Est) |
| NBT Bancorp (NasdaqGS:NBTB) | US$50.08 | US$99.93 | 49.9% |
| Nordic Waterproofing Holding (OM:NWG) | SEK172.40 | SEK344.27 | 49.9% |
| Accent Group (ASX:AX1) | A$2.47 | A$4.94 | 50% |
| EnomotoLtd (TSE:6928) | ¥1472.00 | ¥2935.42 | 49.9% |
| Infomart (TSE:2492) | ¥287.00 | ¥570.08 | 49.7% |
| Nidaros Sparebank (OB:NISB) | NOK100.00 | NOK198.62 | 49.7% |
| Shanghai INT Medical Instruments (SEHK:1501) | HK$27.25 | HK$54.43 | 49.9% |
| Charter Hall Group (ASX:CHC) | A$15.72 | A$31.34 | 49.8% |
| Privia Health Group (NasdaqGS:PRVA) | US$21.66 | US$43.17 | 49.8% |
| Audinate Group (ASX:AD8) | A$8.83 | A$17.54 | 49.7% |
Click here to see the full list of 909 stocks from our Undervalued Stocks Based On Cash Flows screener.
Underneath we present a selection of stocks filtered out by our screen.
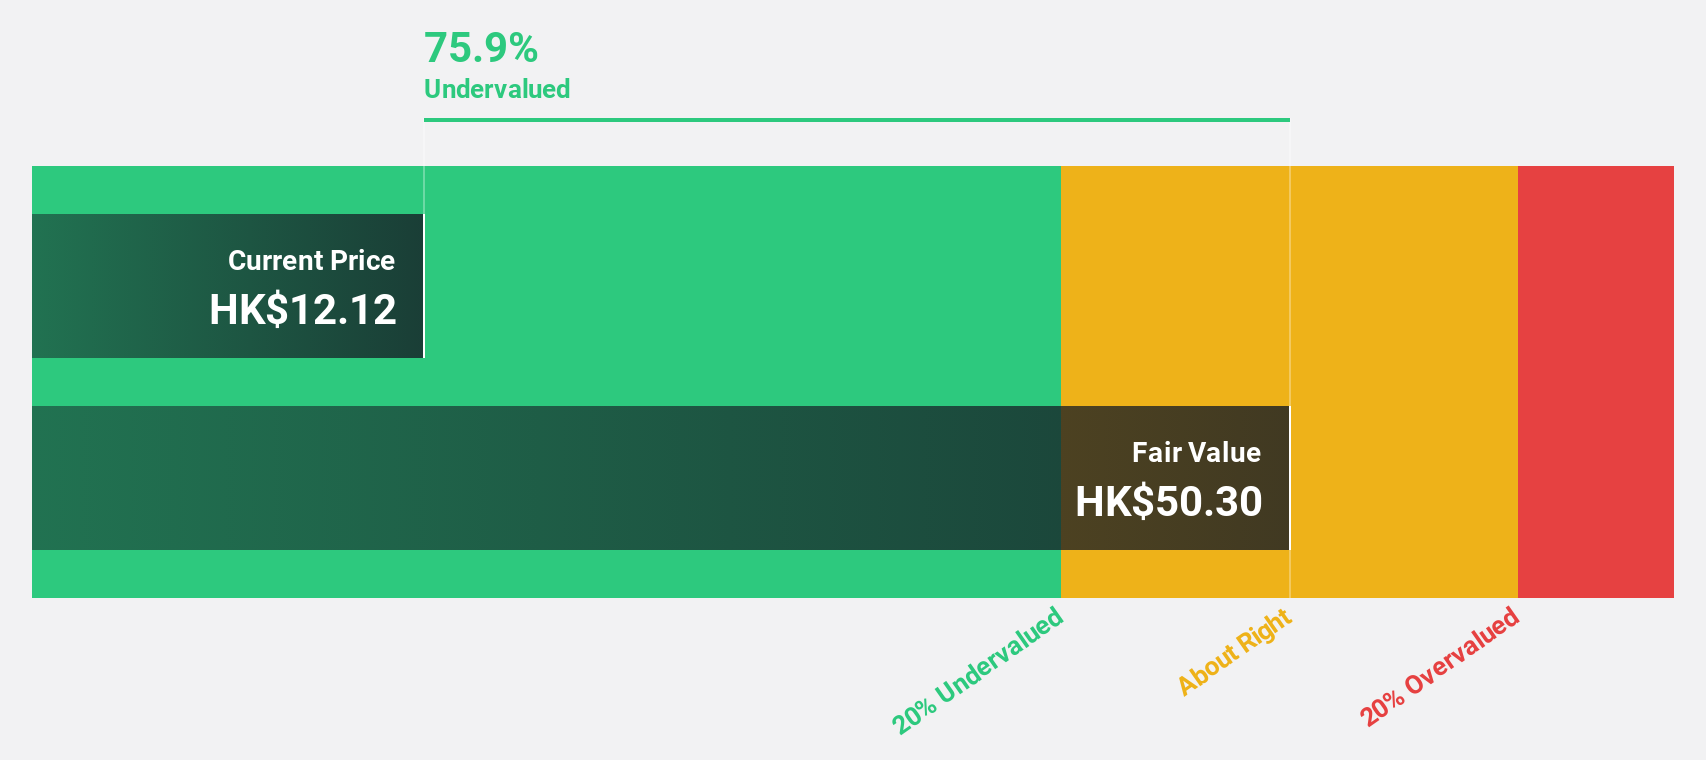
Yadea Group Holdings (SEHK:1585)
Overview: Yadea Group Holdings Ltd. is an investment holding company that develops, manufactures, and sells electric two-wheeled vehicles and related accessories in the People’s Republic of China, with a market cap of HK$37.42 billion.
Operations: The company's revenue is primarily derived from its electric two-wheeled vehicles and related accessories segment, generating CN¥31.76 billion, complemented by CN¥5.23 billion from batteries and electric drive products.
Estimated Discount To Fair Value: 43.4%
Yadea Group Holdings, trading at HK$12.3, is significantly undervalued based on discounted cash flow analysis with a fair value estimate of HK$21.72. Despite slower revenue growth forecasts at 12.8% annually compared to the desired 20%, its earnings are expected to grow faster than the Hong Kong market at 16%. Recent expansions into Thailand and strategic international production bases support sustainable growth in global electric vehicle markets.
- Our comprehensive growth report raises the possibility that Yadea Group Holdings is poised for substantial financial growth.
- Click here to discover the nuances of Yadea Group Holdings with our detailed financial health report.
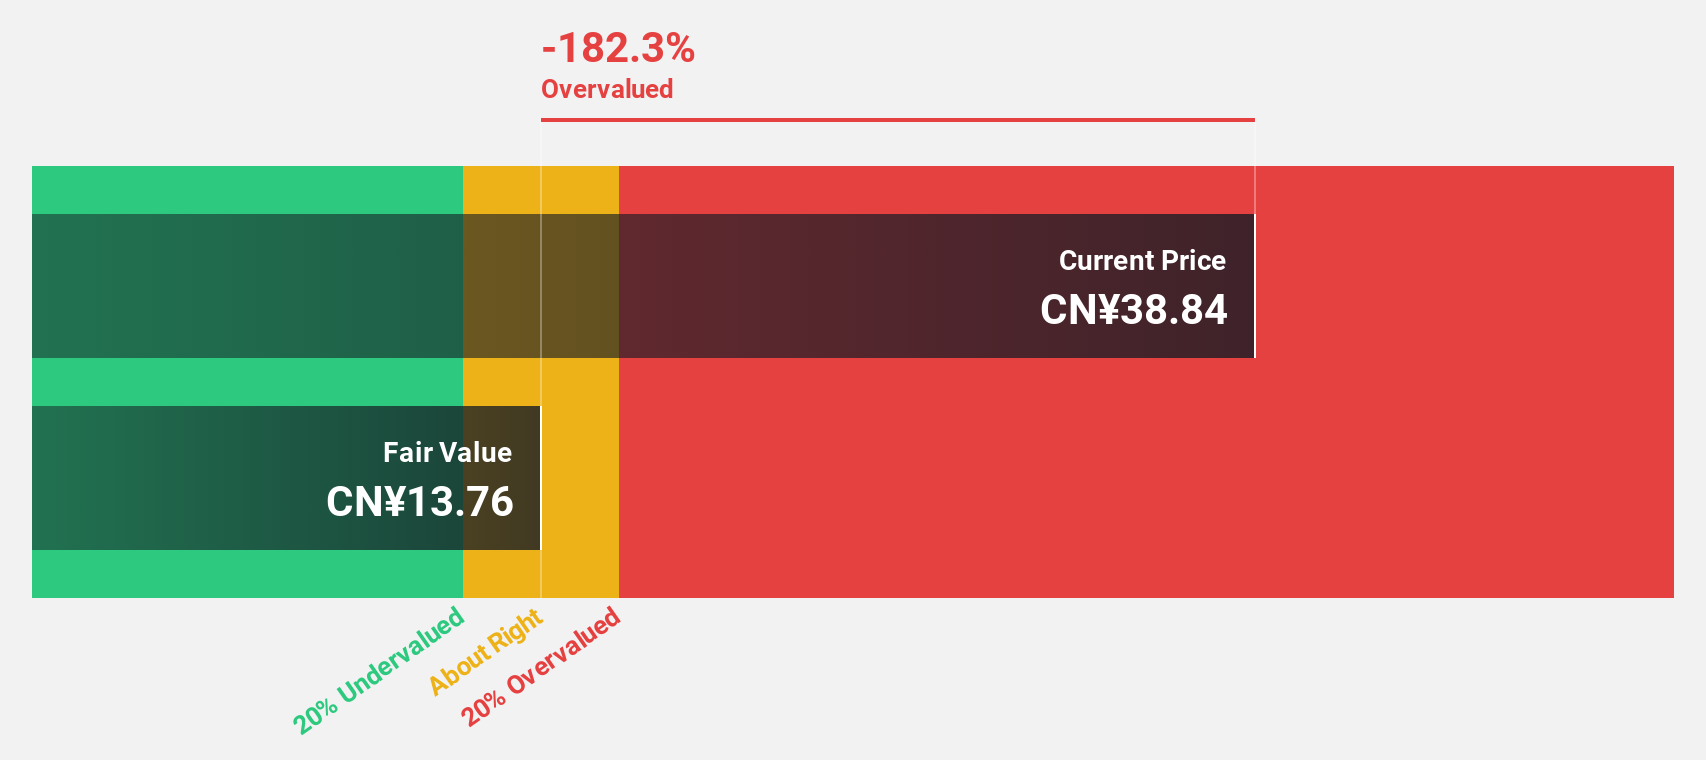
Jonhon Optronic Technology (SZSE:002179)
Overview: Jonhon Optronic Technology Co., Ltd. focuses on the research and development of optical, electrical, and fluid connection technologies and equipment in China, with a market cap of CN¥84.57 billion.
Operations: Jonhon Optronic Technology Co., Ltd. generates revenue through its expertise in developing advanced optical, electrical, and fluid connection technologies and equipment within the Chinese market.
Estimated Discount To Fair Value: 26.5%
Jonhon Optronic Technology, trading at CN¥40.07, is undervalued with a fair value estimate of CN¥54.48 based on discounted cash flow analysis. Despite a decrease in sales and net income for the first nine months of 2024 compared to the previous year, its revenue is forecasted to grow at 22.2% annually, outpacing the Chinese market's growth rate. However, earnings growth is expected to be slower than market averages over the next three years.
- The growth report we've compiled suggests that Jonhon Optronic Technology's future prospects could be on the up.
- Click here and access our complete balance sheet health report to understand the dynamics of Jonhon Optronic Technology.
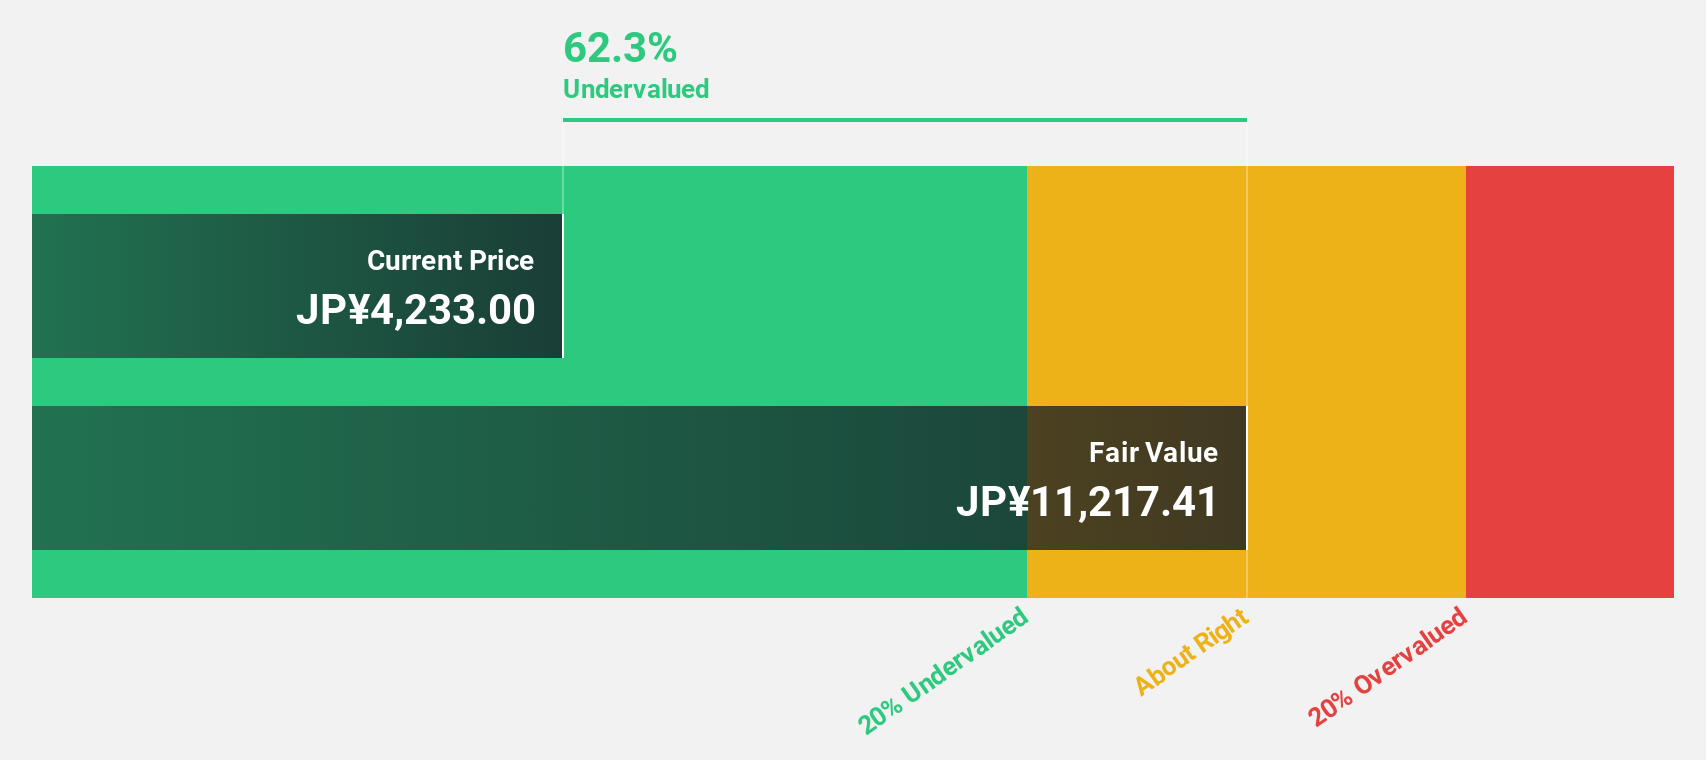
AGC (TSE:5201)
Overview: AGC Inc. is a global manufacturer and seller of glass, automotive, electronics, chemicals, and ceramics with a market cap of ¥981.15 billion.
Operations: The company's revenue is primarily derived from its Chemicals segment at ¥588.00 billion, followed by Automotive at ¥508.51 billion, Architectural Glass at ¥451.29 billion, Electronics at ¥354.55 billion, and Life Science at ¥135.05 billion.
Estimated Discount To Fair Value: 40.9%
AGC is trading at ¥4,706, significantly below its estimated fair value of ¥7,963.26. Despite a projected annual earnings growth of 73.18% and revenue growth outpacing the Japanese market slightly at 4.3%, AGC faces challenges with an expected loss for 2024 and a low forecasted return on equity of 8.7%. Recent product innovations in high-speed communication materials highlight strategic focus areas, potentially enhancing future cash flows despite current financial setbacks.
- Insights from our recent growth report point to a promising forecast for AGC's business outlook.
- Unlock comprehensive insights into our analysis of AGC stock in this financial health report.
Seize The Opportunity
- Gain an insight into the universe of 909 Undervalued Stocks Based On Cash Flows by clicking here.
- Got skin in the game with these stocks? Elevate how you manage them by using Simply Wall St's portfolio, where intuitive tools await to help optimize your investment outcomes.
- Simply Wall St is a revolutionary app designed for long-term stock investors, it's free and covers every market in the world.
Curious About Other Options?
- Explore high-performing small cap companies that haven't yet garnered significant analyst attention.
- Diversify your portfolio with solid dividend payers offering reliable income streams to weather potential market turbulence.
- Fuel your portfolio with companies showing strong growth potential, backed by optimistic outlooks both from analysts and management.
This article by Simply Wall St is general in nature. We provide commentary based on historical data and analyst forecasts only using an unbiased methodology and our articles are not intended to be financial advice. It does not constitute a recommendation to buy or sell any stock, and does not take account of your objectives, or your financial situation. We aim to bring you long-term focused analysis driven by fundamental data. Note that our analysis may not factor in the latest price-sensitive company announcements or qualitative material. Simply Wall St has no position in any stocks mentioned.
New: Manage All Your Stock Portfolios in One Place
We've created the ultimate portfolio companion for stock investors, and it's free.
• Connect an unlimited number of Portfolios and see your total in one currency• Be alerted to new Warning Signs or Risks via email or mobile• Track the Fair Value of your stocks
Try a Demo Portfolio for FreeHave feedback on this article? Concerned about the content? Get in touch with us directly. Alternatively, email editorial-team@simplywallst.com
免責聲明:投資有風險,本文並非投資建議,以上內容不應被視為任何金融產品的購買或出售要約、建議或邀請,作者或其他用戶的任何相關討論、評論或帖子也不應被視為此類內容。本文僅供一般參考,不考慮您的個人投資目標、財務狀況或需求。TTM對信息的準確性和完整性不承擔任何責任或保證,投資者應自行研究並在投資前尋求專業建議。
熱議股票
- 1
- 2
- 3
- 4
- 5
- 6
- 7
- 8
- 9
- 10