Hedera (HBAR) Price Achieves Major Milestone in Historic 700% Rally
- HBAR price surged 721% in 30 days, with $13.44B market cap surpassing SUI, UNI, and LTC.
- Technical indicators show strong bullish momentum with potential targets at $0.45 and $0.50.
- HBAR support levels established at $0.27, $0.19, and $0.12 for potential consolidation phases.
Hedera (HBAR) price has surged to its highest levels since 2021, showcasing remarkable momentum in the cryptocurrency market. The coin has skyrocketed 721% over the past 30 days, outperforming most major cryptos in terms of gains.
With a market cap now reaching $13.44 billion, HBAR has surpassed notable projects like SUI, Uniswap, and Litecoin. Technical indicators across multiple timeframes suggest strong bullish momentum, though some metrics hint at potential consolidation ahead.
HBAR Current Uptrend Is Still Strong
HBAR Directional Movement Index (DMI) shows a very strong trend with an Average Directional Index (ADX) reading of 72.
ADX measures trend strength regardless of direction, with values above 25 indicating a strong trend and readings above 50 suggesting an exceptionally strong trend. At 72, HBAR ADX indicates an extremely powerful trend momentum in the market.
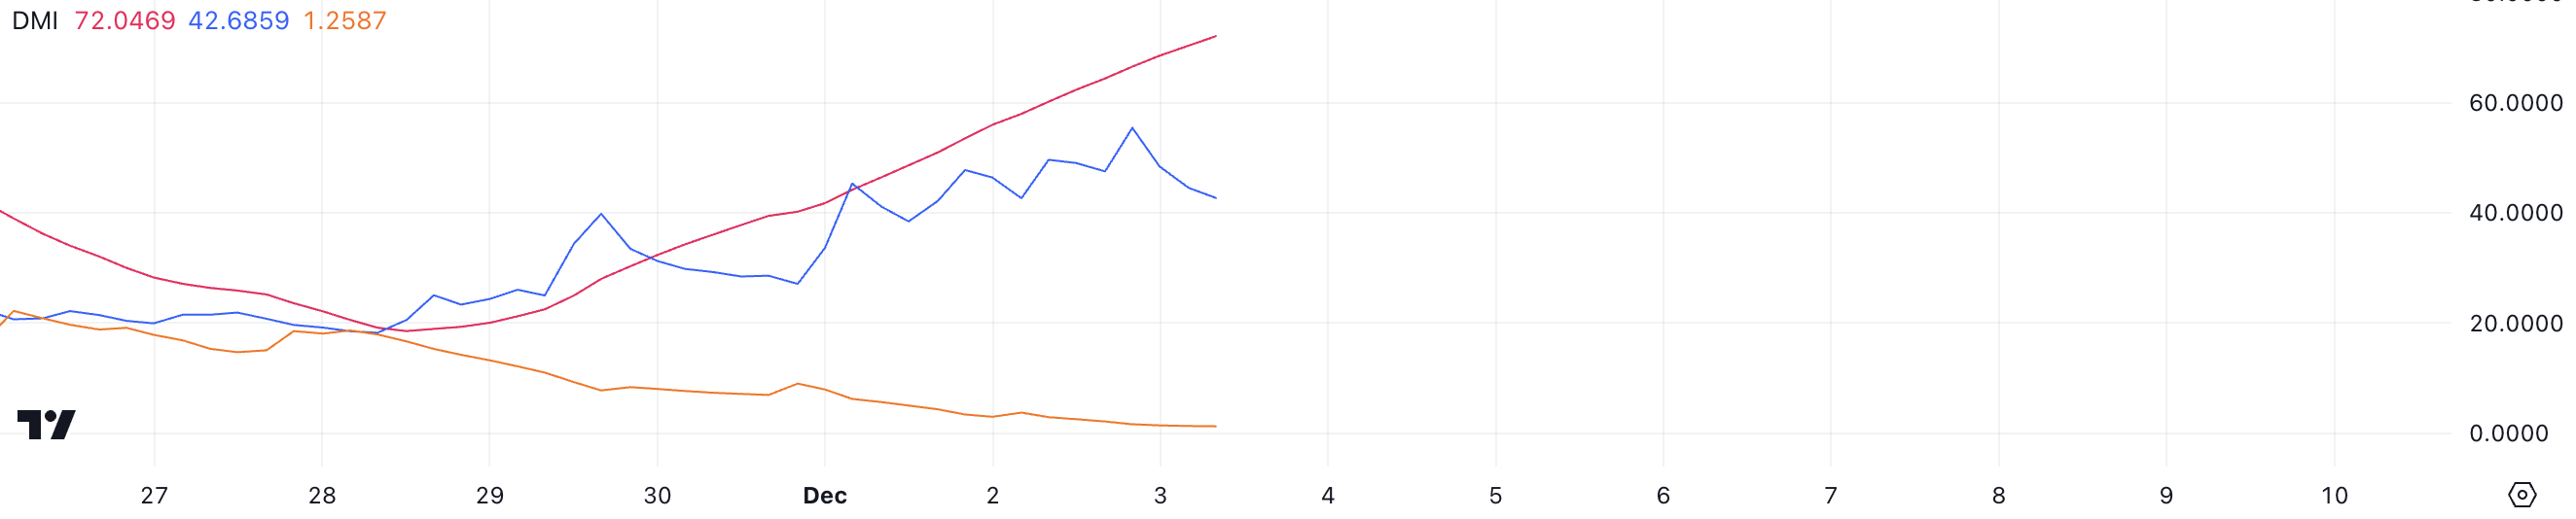
The Positive Directional Indicator (D+) at 42.6, despite dropping from 55, coupled with a very low Negative Directional Indicator (D-) of 1.2, confirms strong bullish momentum for HBAR price.
The large spread between D+ and D- supports the continuation of the uptrend, though the declining D+ value suggests some weakening in buying pressure. However, as long as D+ remains significantly above D-, the bullish trend structure remains intact.
Ichimoku Cloud Shows Hedera Price Could Be Overextended
The Ichimoku Cloud chart for Hedera shows strong bullish momentum, with price trading well above both the base line (kijun-sen) and conversion line (tenkan-sen).
The wide separation between these lines indicates accelerating upward momentum, though prices may be stretching too far above the baseline.
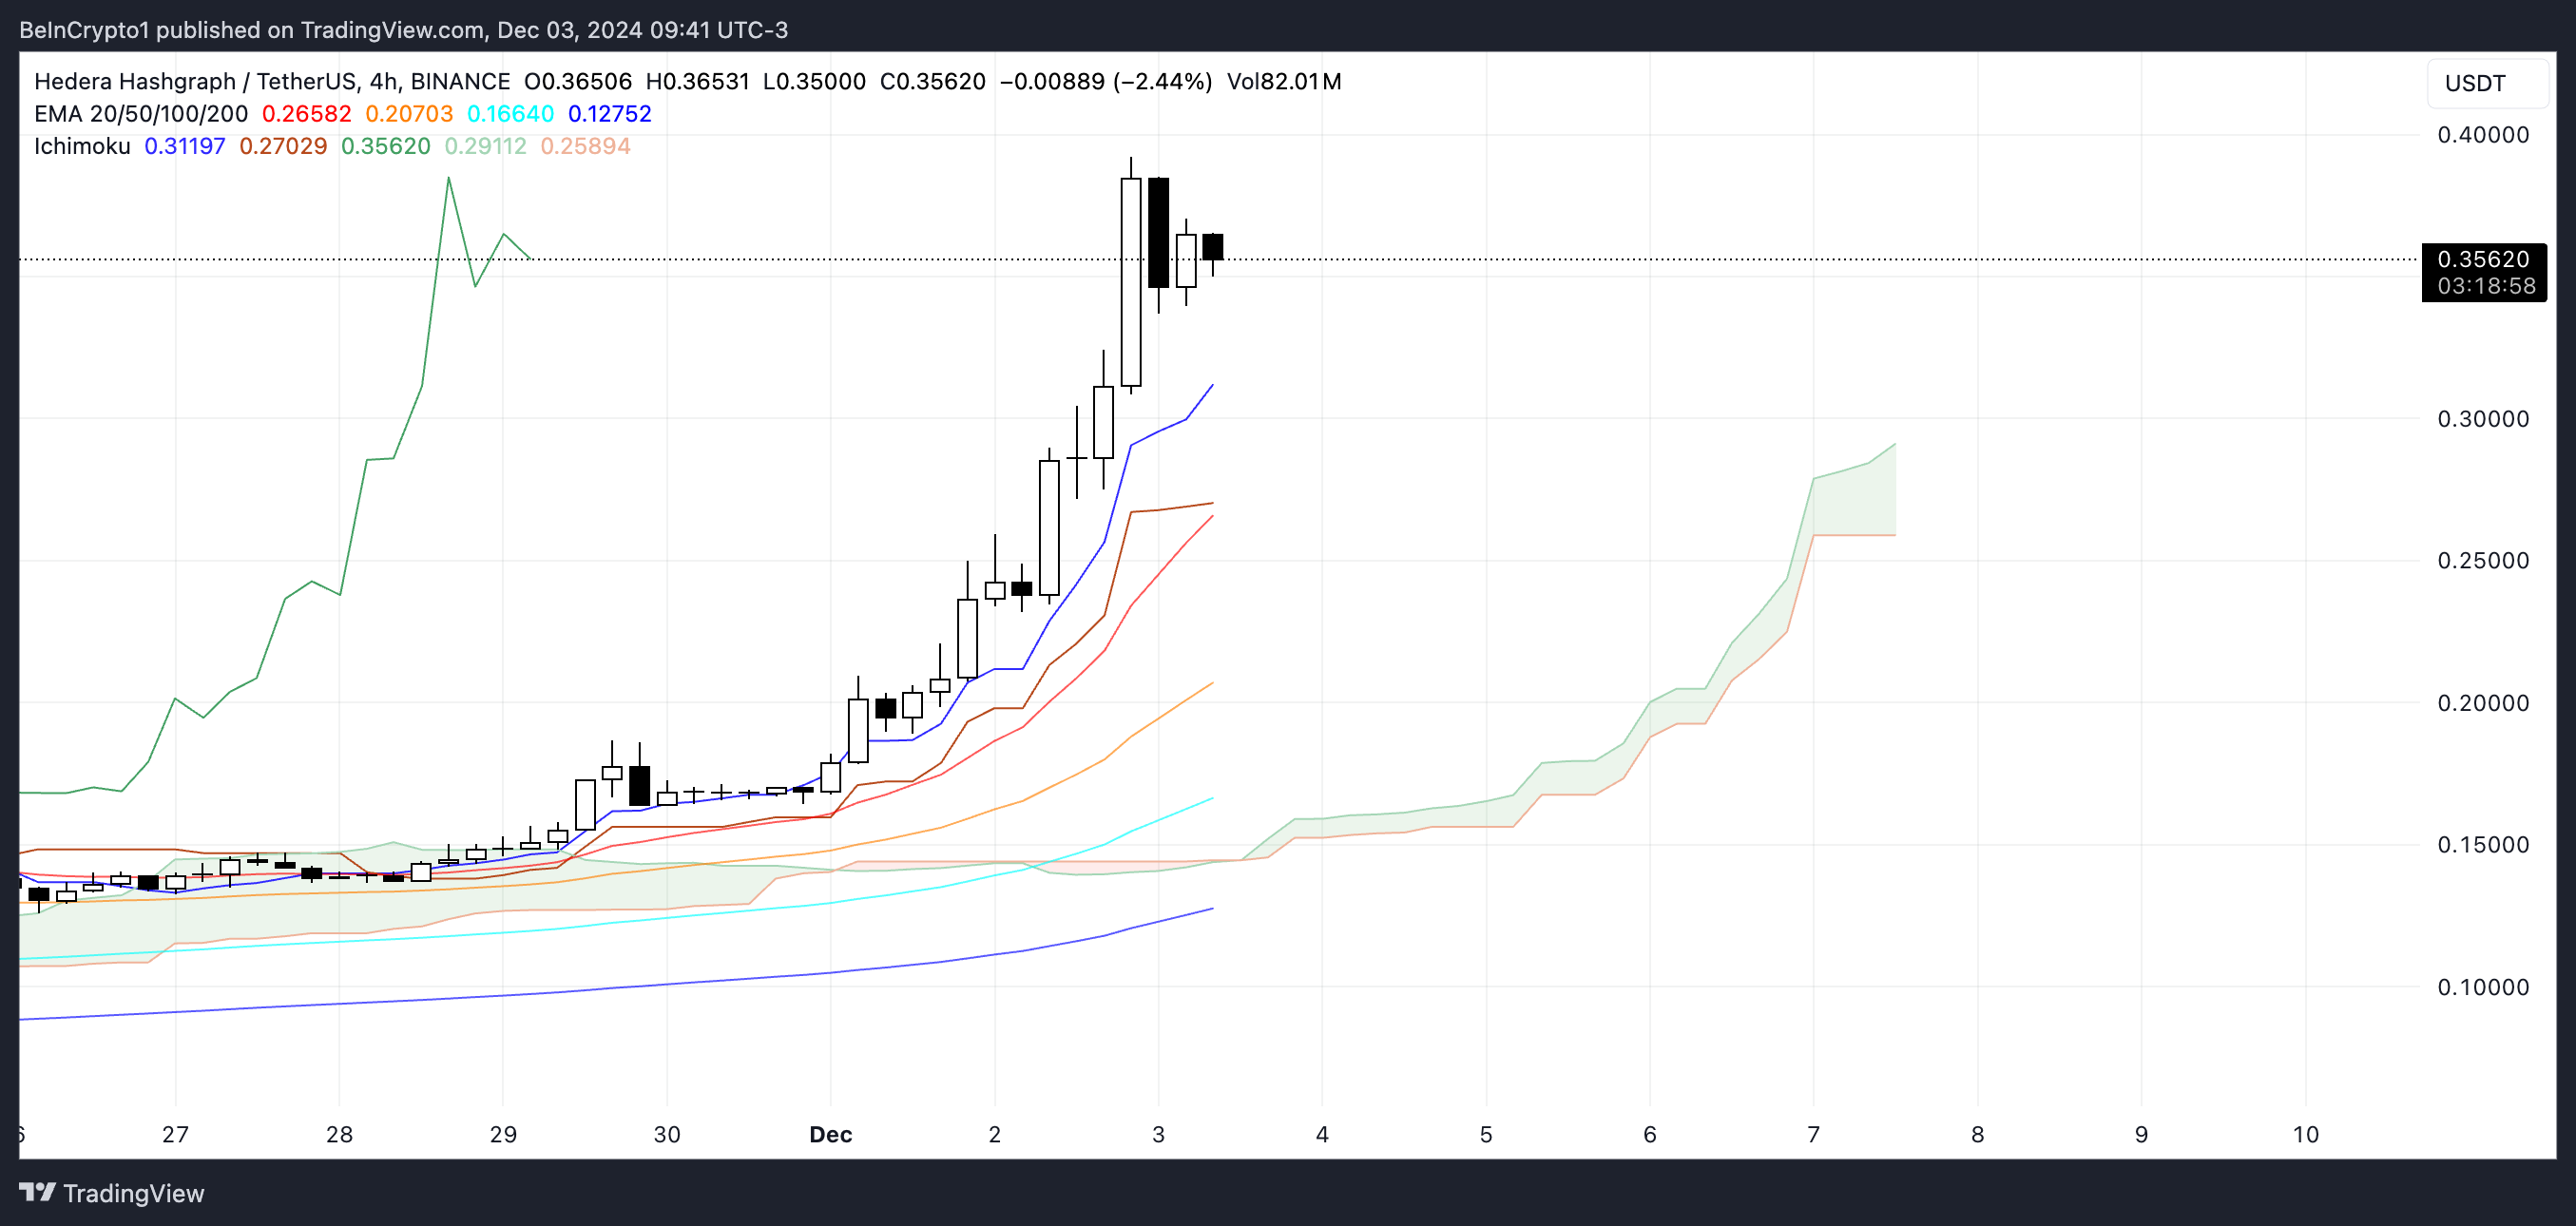
The cloud (kumo) structure is bullish with future cloud formation trending upward, suggesting continued upward support.
However, the significant distance between the current Hedera price and the cloud suggests the price may be overextended in the short term, potentially setting up a retest of the baseline or cloud top as support levels during any consolidation phase.
HBAR Price Prediction: Can It Retreace to $0.27?
Hedera price action shows exceptional bullish momentum, rising 721% in 30 days to reach levels unseen since 2021. The EMAs are in perfect bullish alignment, with shorter timeframes leading above longer ones, suggesting continued upward momentum.
A break above the $0.39 resistance level could trigger further advances toward psychological levels at $0.45 and $0.50, representing a potential upside of 42%.
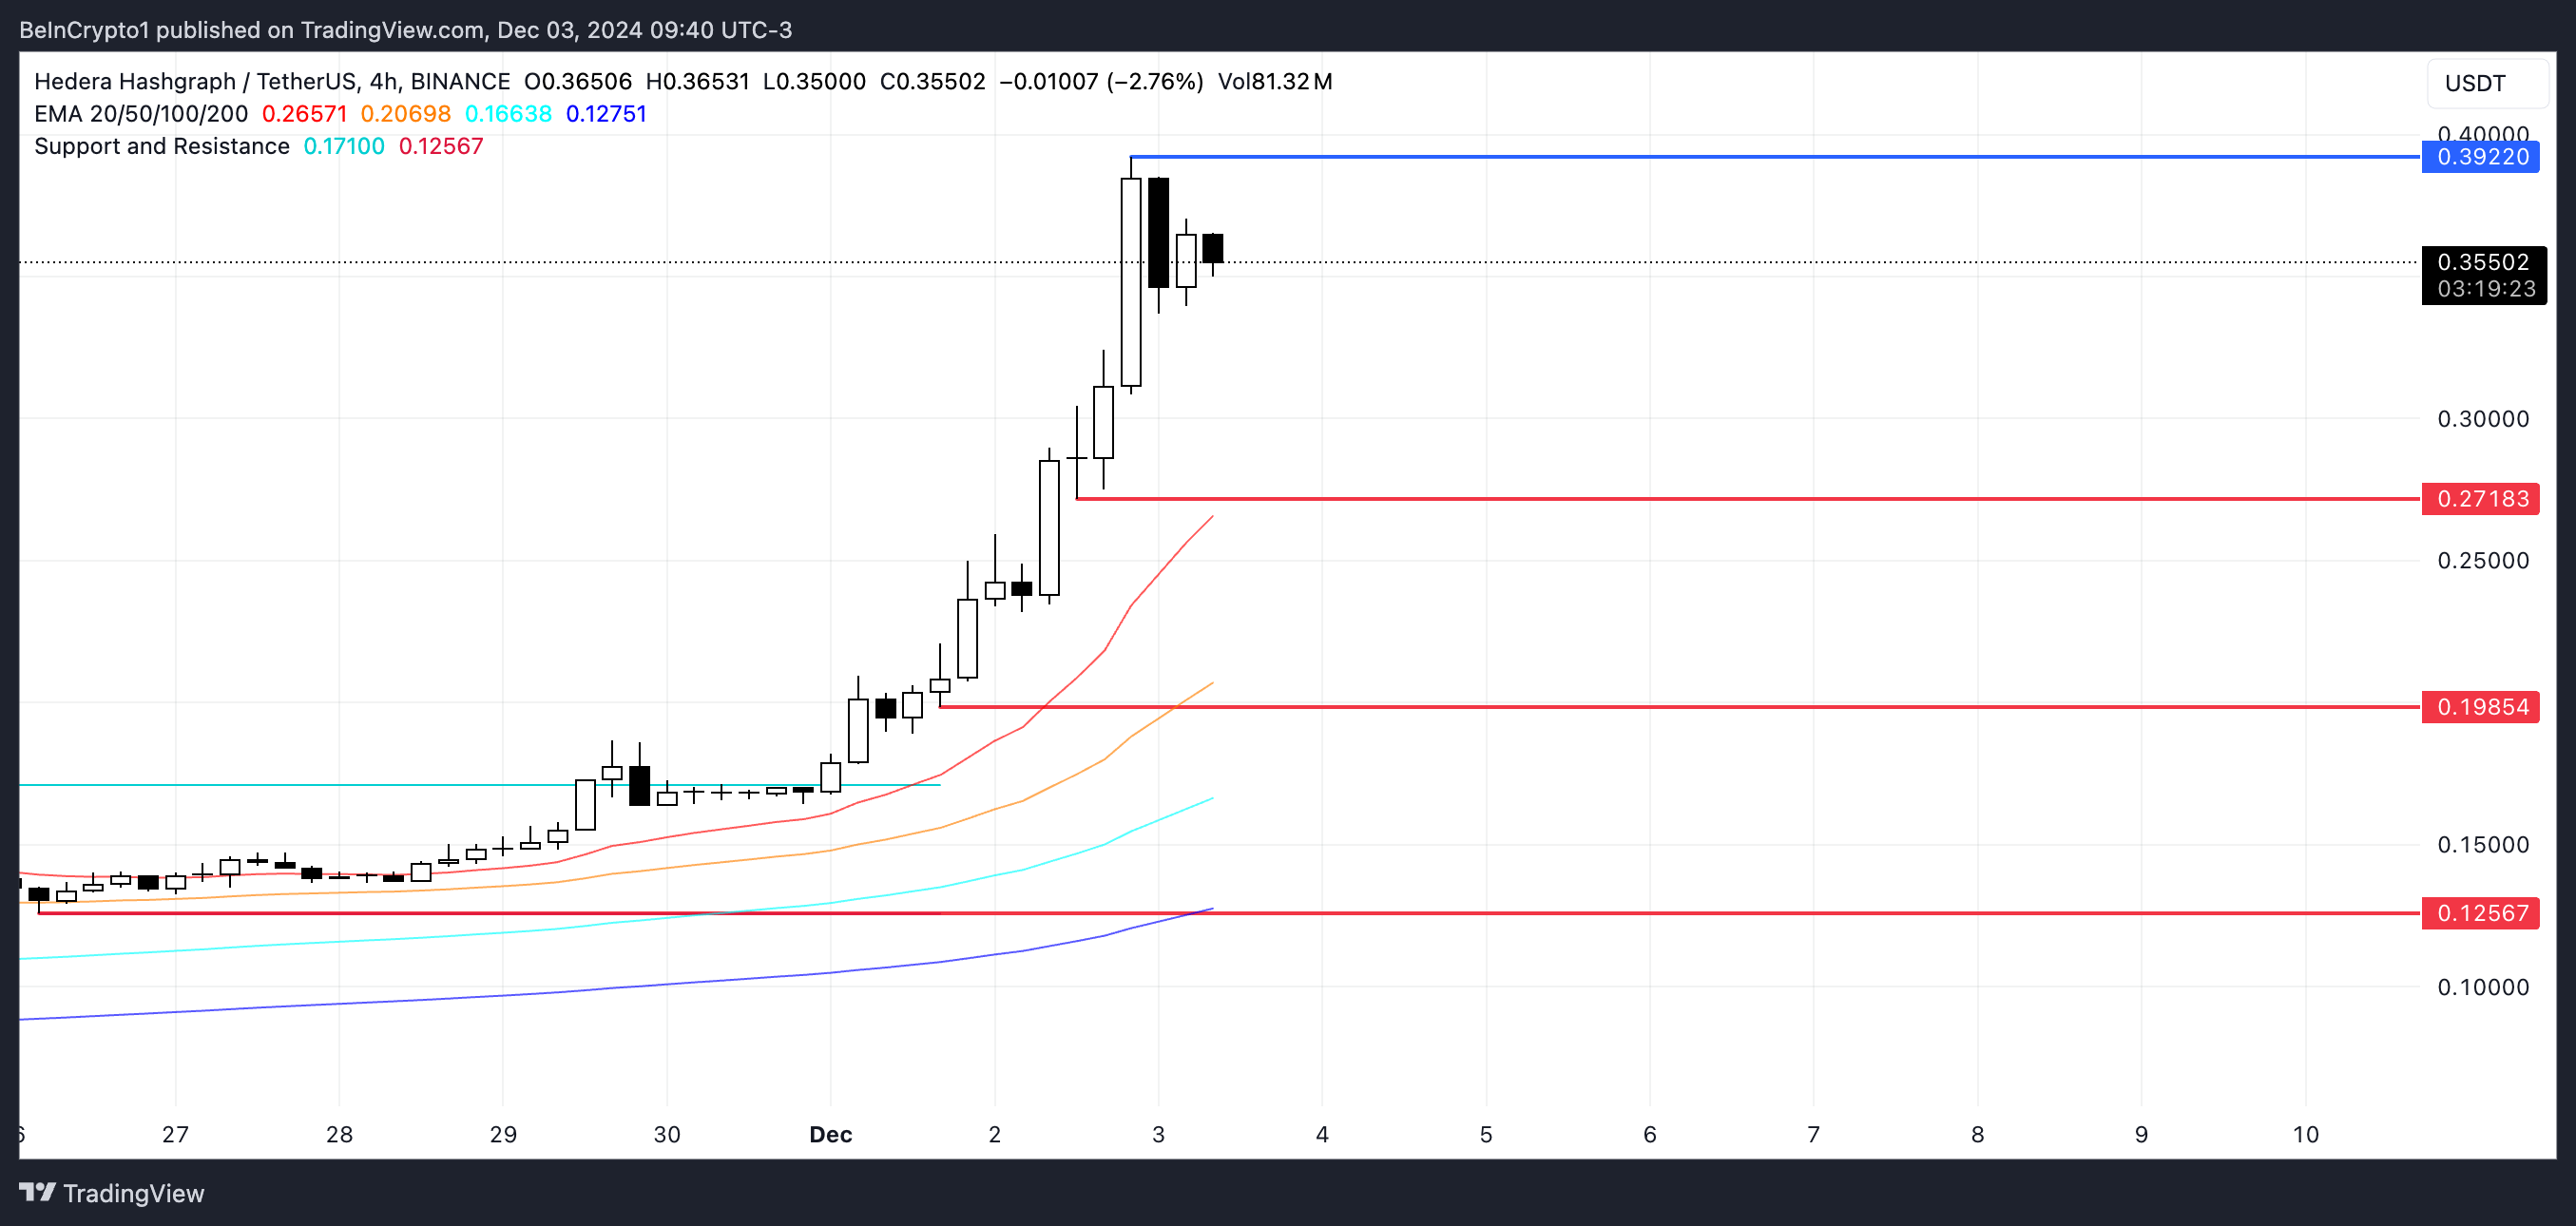
However, the extended rally has pushed price significantly above key EMAs and the Ichimoku Cloud, indicating possible overextension for HBAR price.
Support levels at $0.27 and $0.19 could provide bouncing points during any corrective moves, with $0.12 serving as critical support if selling pressure intensifies.
免責聲明:投資有風險,本文並非投資建議,以上內容不應被視為任何金融產品的購買或出售要約、建議或邀請,作者或其他用戶的任何相關討論、評論或帖子也不應被視為此類內容。本文僅供一般參考,不考慮您的個人投資目標、財務狀況或需求。TTM對信息的準確性和完整性不承擔任何責任或保證,投資者應自行研究並在投資前尋求專業建議。
熱議股票
- 1
- 2
- 3
- 4
- 5
- 6
- 7
- 8
- 9
- 10