Uniswap (UNI) Surges Past $10 Billion Market Cap With More Room to Grow
- Uniswap (UNI) price rises 80.44% in 30 days, crossing a $10 billion market cap with RSI at 67, signaling room for further growth.
- ADX at 39 confirms a strong uptrend despite a slight momentum dip, with potential consolidation before continued gains.
- UNI could test $17.39 resistance and reach $20, its highest since 2021, if bullish momentum persists; key support lies at $13.5.
Uniswap (UNI) price has seen impressive growth, crossing the $10 billion market cap and rising 80.44% in the last 30 days. With the price currently at 67 on the Relative Strength Index (RSI), UNI is approaching overbought territory but still has room to grow before signaling an immediate correction.
Despite a slight dip in the Average Directional Index (ADX) from 46 to 39, UNI remains in a strong uptrend with a trend strength above 25. If the uptrend continues, UNI could test the resistance at $17.39, potentially reaching $20, its highest price since 2021.
UNI RSI Is Still Below Overbought Zone
Uniswap RSI is currently at 67, meaning it is approaching overbought territory but hasn’t yet reached the 70 mark.
RSI values above 70 typically suggest the asset is overbought, but at 67, UNI still has room to grow without signaling an immediate correction.
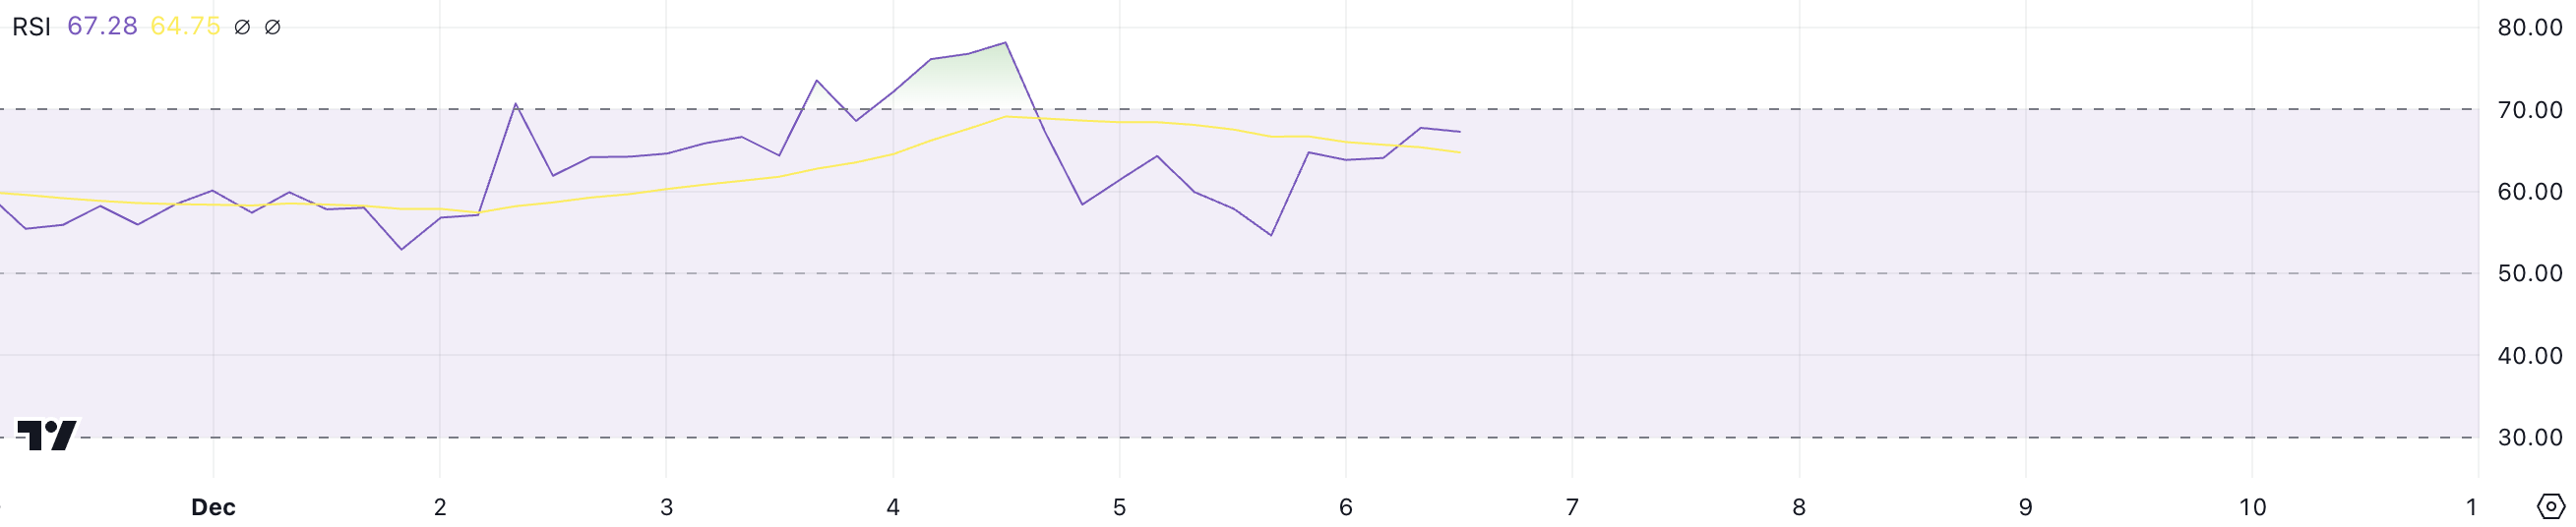
RSI measures price momentum on a scale from 0 to 100, with values above 70 indicating overbought conditions and below 30 suggesting oversold conditions.
Since UNI RSI stayed above 70 during recent price spikes, the current level of 67 shows there is still potential for growth before a correction might occur.
Uniswap ADX Shows the Current Uptrend Is Strong
UNI’s ADX is currently at 39, down from 46 just two days ago, indicating a slight decrease in trend strength.
While this drop suggests a reduction in momentum, the ADX still remains above 25, which signals that UNI price is in a strong trend, despite the recent pullback.
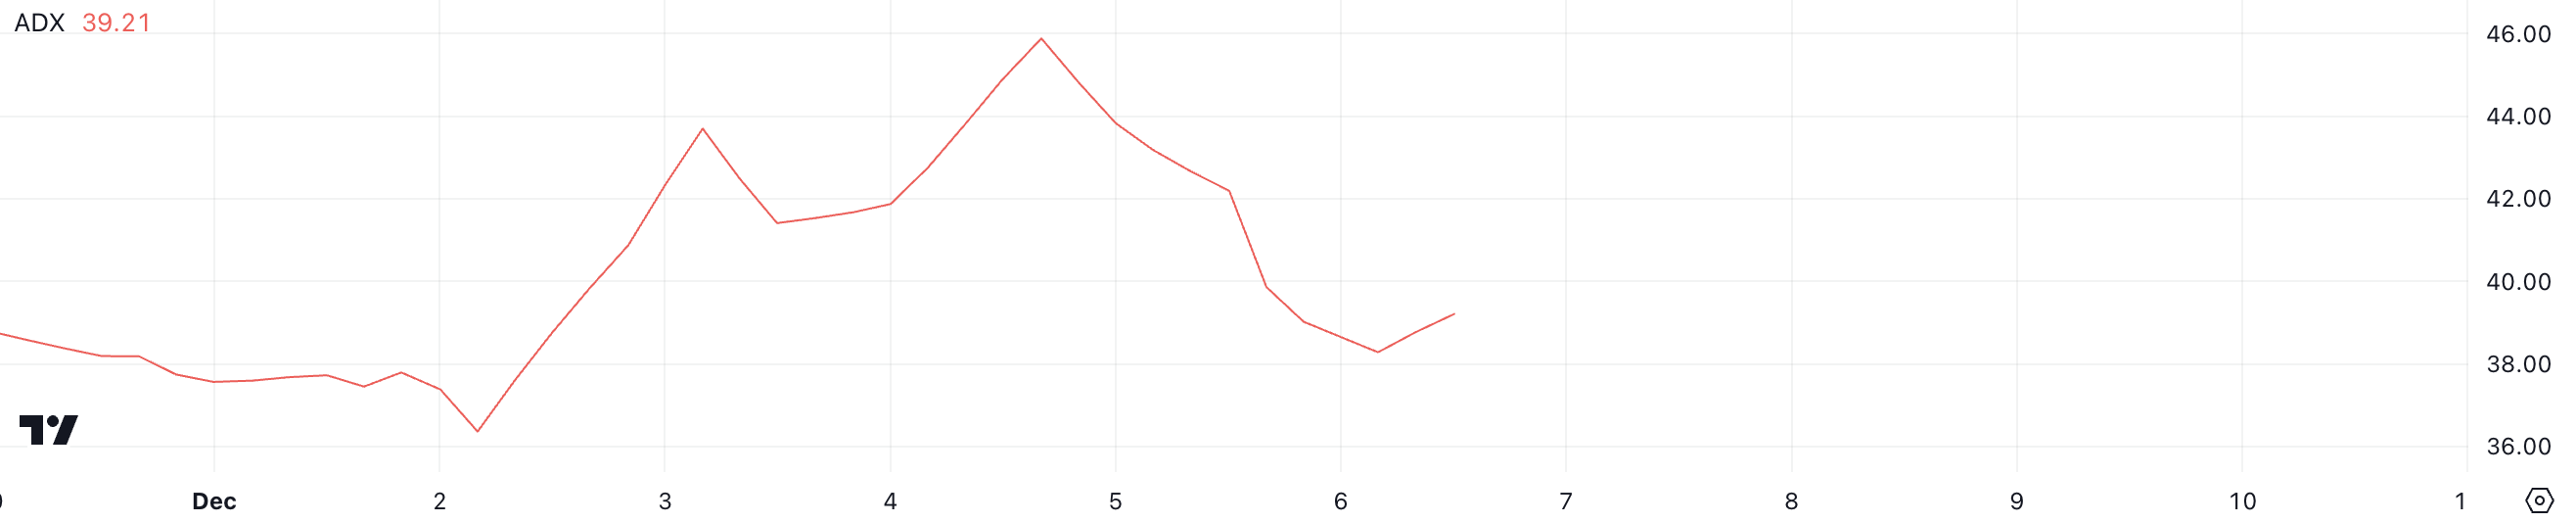
The Average Directional Index (ADX) measures the strength of a trend, with values above 25 indicating a strong trend and values below 20 suggesting weak or no trend.
Since UNI’s ADX is at 39, it shows that the asset is still in a strong uptrend, although the recent decrease suggests a potential slowdown in momentum. The ADX at 39 indicates that UNI bullish trend remains intact, but there may be a brief consolidation before further gains.
UNI Price Prediction: Can It Rise Back to $20 After 3 Years?
If the uptrend continues, UNI price could test the resistance at $17.39 and potentially rise up to $20, marking its highest price since 2021.
This would signal a strong continuation of the bullish momentum, with Uniswap price aiming for significant gains.
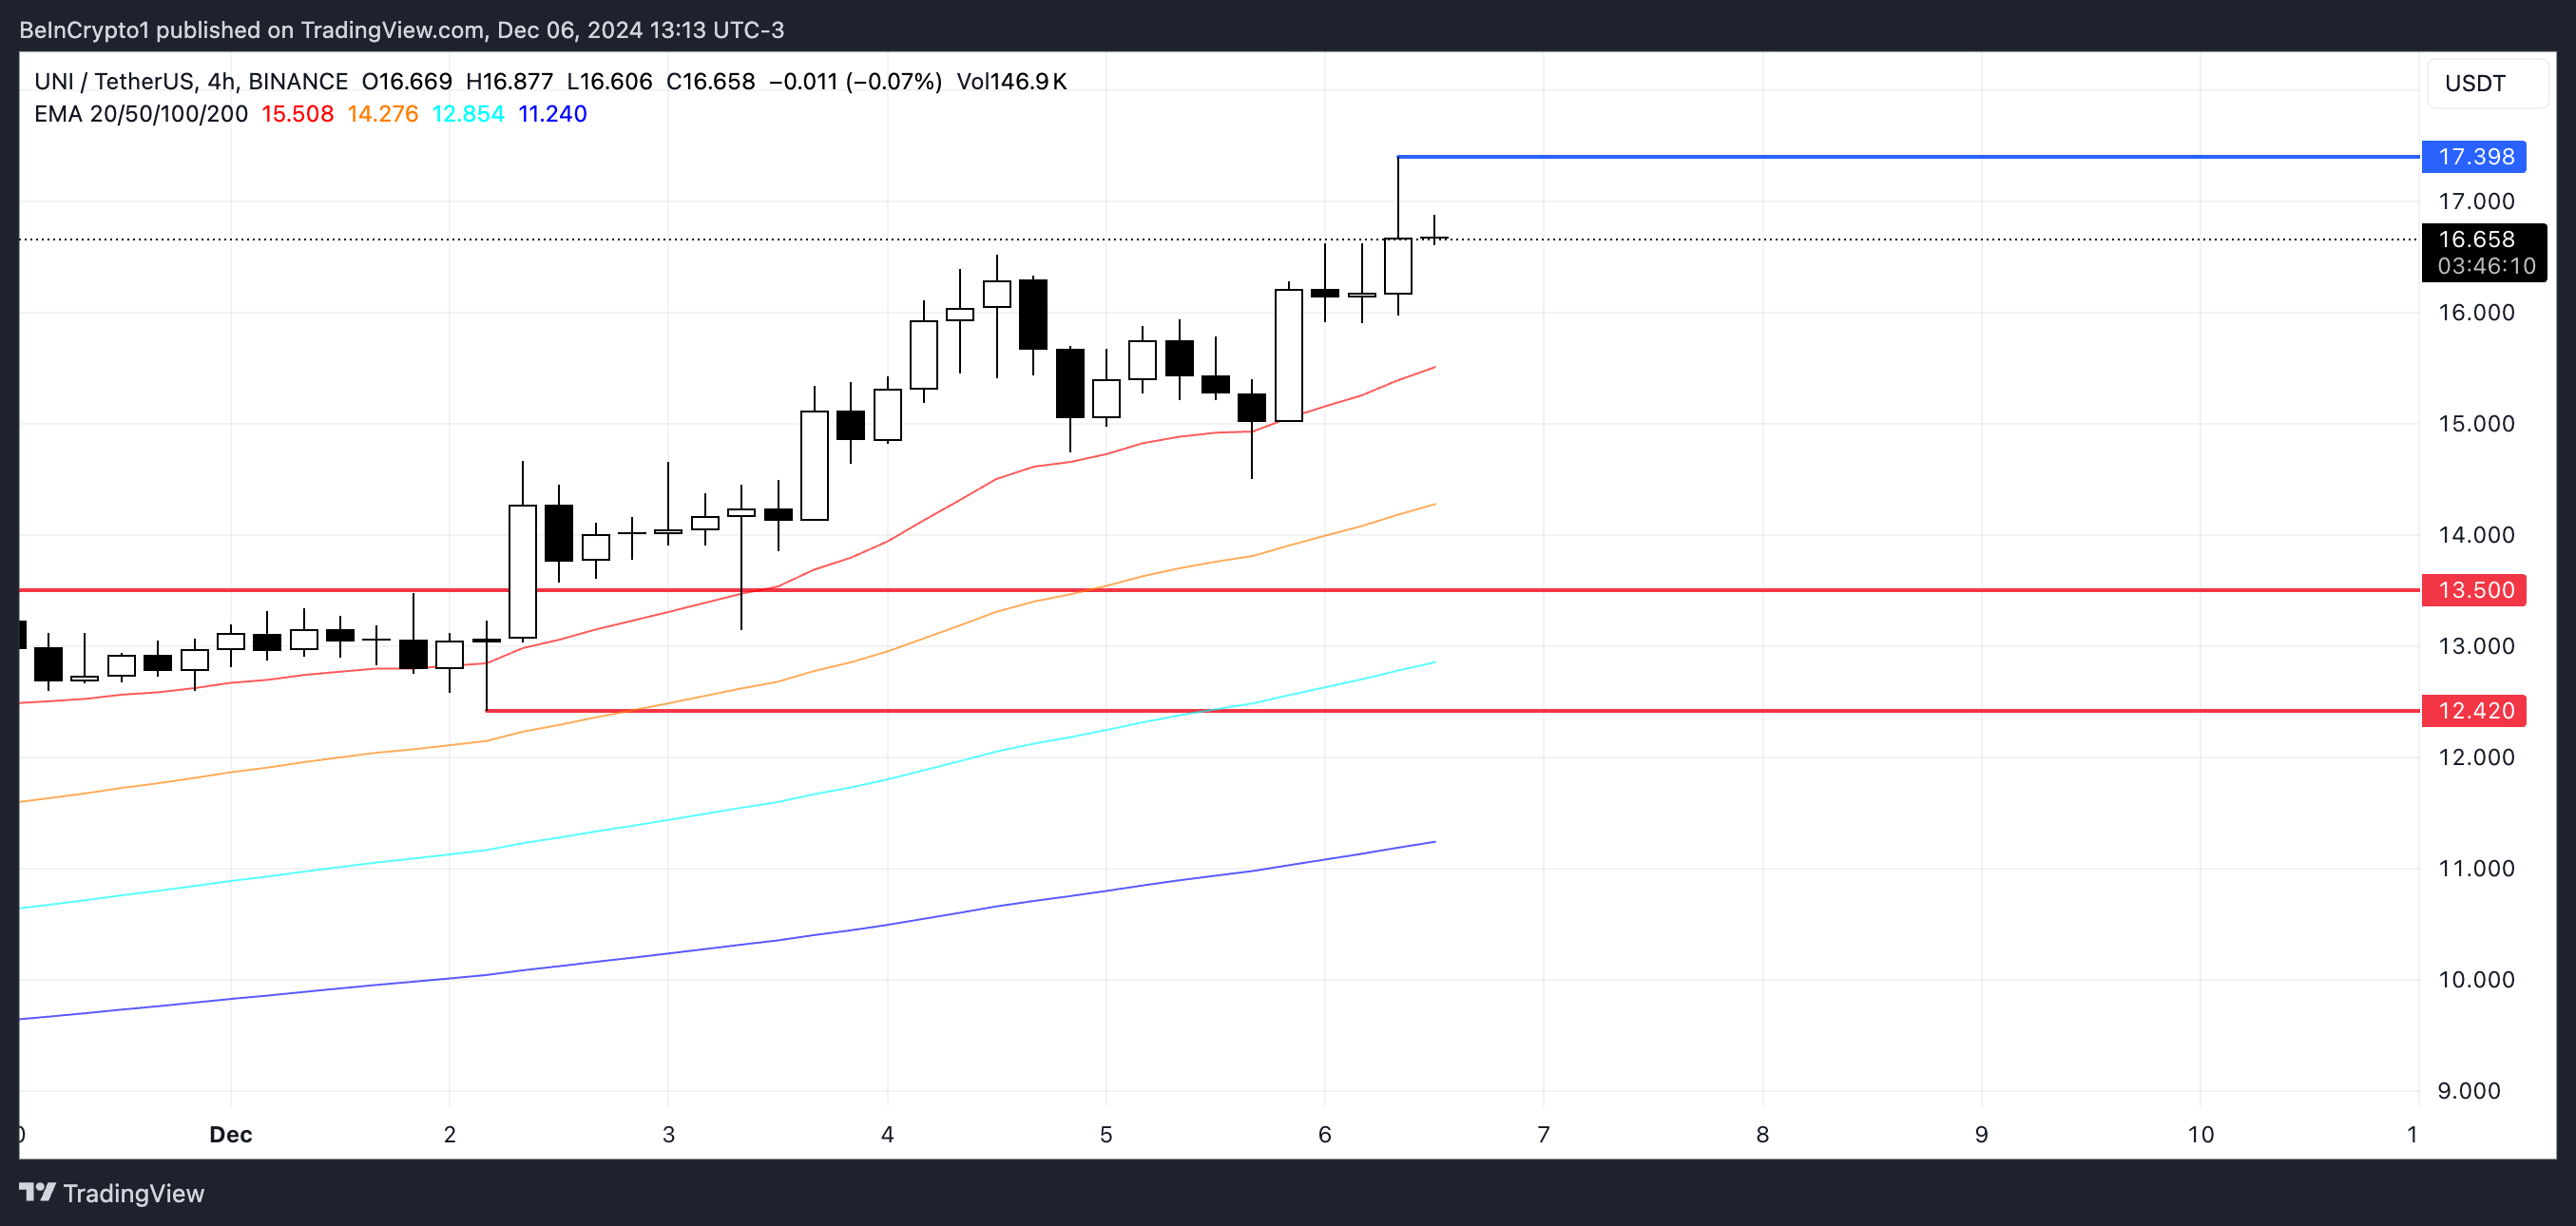
However, if the current trend reverses, Uniswap price could test the first support level around $13.5. If this support fails to hold, the price could drop further, potentially reaching as low as $12.4, indicating a bearish shift if the trend doesn’t regain strength.
免責聲明:投資有風險,本文並非投資建議,以上內容不應被視為任何金融產品的購買或出售要約、建議或邀請,作者或其他用戶的任何相關討論、評論或帖子也不應被視為此類內容。本文僅供一般參考,不考慮您的個人投資目標、財務狀況或需求。TTM對信息的準確性和完整性不承擔任何責任或保證,投資者應自行研究並在投資前尋求專業建議。
熱議股票
- 1
- 2
- 3
- 4
- 5
- 6
- 7
- 8
- 9
- 10