Sapiens International Corporation N.V. (NASDAQ:SPNS) surges 3.7%; public companies who own 44% shares profited along with institutions
Key Insights
- Sapiens International's significant public companies ownership suggests that the key decisions are influenced by shareholders from the larger public
- A total of 4 investors have a majority stake in the company with 51% ownership
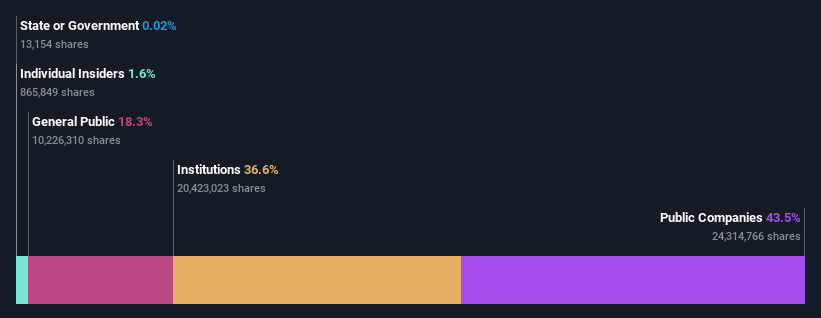
- 37% of Sapiens International is held by Institutions
Every investor in Sapiens International Corporation N.V. (NASDAQ:SPNS) should be aware of the most powerful shareholder groups. We can see that public companies own the lion's share in the company with 44% ownership. That is, the group stands to benefit the most if the stock rises (or lose the most if there is a downturn).
Public companies gained the most after market cap touched US$1.5b last week, while institutions who own 37% also benefitted.
Let's delve deeper into each type of owner of Sapiens International, beginning with the chart below.
See our latest analysis for Sapiens International
What Does The Institutional Ownership Tell Us About Sapiens International?
Institutions typically measure themselves against a benchmark when reporting to their own investors, so they often become more enthusiastic about a stock once it's included in a major index. We would expect most companies to have some institutions on the register, especially if they are growing.
We can see that Sapiens International does have institutional investors; and they hold a good portion of the company's stock. This implies the analysts working for those institutions have looked at the stock and they like it. But just like anyone else, they could be wrong. When multiple institutions own a stock, there's always a risk that they are in a 'crowded trade'. When such a trade goes wrong, multiple parties may compete to sell stock fast. This risk is higher in a company without a history of growth. You can see Sapiens International's historic earnings and revenue below, but keep in mind there's always more to the story.

Hedge funds don't have many shares in Sapiens International. Our data shows that Formula Systems (1985) Ltd. is the largest shareholder with 44% of shares outstanding. In comparison, the second and third largest shareholders hold about 3.1% and 2.5% of the stock. In addition, we found that Roni Al-Dor, the CEO has 1.6% of the shares allocated to their name.
To make our study more interesting, we found that the top 4 shareholders control more than half of the company which implies that this group has considerable sway over the company's decision-making.
While it makes sense to study institutional ownership data for a company, it also makes sense to study analyst sentiments to know which way the wind is blowing. There are a reasonable number of analysts covering the stock, so it might be useful to find out their aggregate view on the future.
Insider Ownership Of Sapiens International
While the precise definition of an insider can be subjective, almost everyone considers board members to be insiders. Company management run the business, but the CEO will answer to the board, even if he or she is a member of it.
Insider ownership is positive when it signals leadership are thinking like the true owners of the company. However, high insider ownership can also give immense power to a small group within the company. This can be negative in some circumstances.
Our most recent data indicates that insiders own some shares in Sapiens International Corporation N.V.. It is a pretty big company, so it is generally a positive to see some potentially meaningful alignment. In this case, they own around US$24m worth of shares (at current prices). If you would like to explore the question of insider alignment, you can click here to see if insiders have been buying or selling.
General Public Ownership
The general public, who are usually individual investors, hold a 18% stake in Sapiens International. While this size of ownership may not be enough to sway a policy decision in their favour, they can still make a collective impact on company policies.
Public Company Ownership
Public companies currently own 44% of Sapiens International stock. We can't be certain but it is quite possible this is a strategic stake. The businesses may be similar, or work together.
Next Steps:
While it is well worth considering the different groups that own a company, there are other factors that are even more important.
I like to dive deeper into how a company has performed in the past. You can find historic revenue and earnings in this detailed graph.
If you would prefer discover what analysts are predicting in terms of future growth, do not miss this free report on analyst forecasts.
NB: Figures in this article are calculated using data from the last twelve months, which refer to the 12-month period ending on the last date of the month the financial statement is dated. This may not be consistent with full year annual report figures.
New: Manage All Your Stock Portfolios in One Place
We've created the ultimate portfolio companion for stock investors, and it's free.
• Connect an unlimited number of Portfolios and see your total in one currency• Be alerted to new Warning Signs or Risks via email or mobile• Track the Fair Value of your stocks
Try a Demo Portfolio for FreeHave feedback on this article? Concerned about the content? Get in touch with us directly. Alternatively, email editorial-team (at) simplywallst.com.This article by Simply Wall St is general in nature. We provide commentary based on historical data and analyst forecasts only using an unbiased methodology and our articles are not intended to be financial advice. It does not constitute a recommendation to buy or sell any stock, and does not take account of your objectives, or your financial situation. We aim to bring you long-term focused analysis driven by fundamental data. Note that our analysis may not factor in the latest price-sensitive company announcements or qualitative material. Simply Wall St has no position in any stocks mentioned.
免責聲明:投資有風險,本文並非投資建議,以上內容不應被視為任何金融產品的購買或出售要約、建議或邀請,作者或其他用戶的任何相關討論、評論或帖子也不應被視為此類內容。本文僅供一般參考,不考慮您的個人投資目標、財務狀況或需求。TTM對信息的準確性和完整性不承擔任何責任或保證,投資者應自行研究並在投資前尋求專業建議。
熱議股票
- 1
- 2
- 3
- 4
- 5
- 6
- 7
- 8
- 9
- 10