Are Investors Undervaluing CapitaLand India Trust (SGX:CY6U) By 25%?
Key Insights
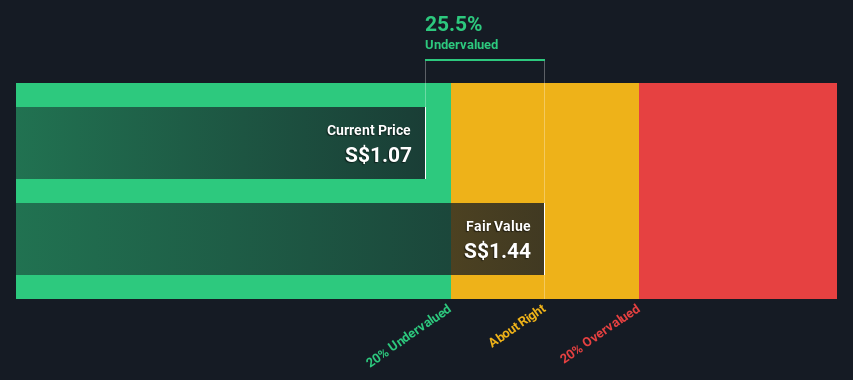
- CapitaLand India Trust's estimated fair value is S$1.44 based on Dividend Discount Model
- CapitaLand India Trust is estimated to be 25% undervalued based on current share price of S$1.07
- Analyst price target for CY6U is S$1.28 which is 11% below our fair value estimate
In this article we are going to estimate the intrinsic value of CapitaLand India Trust (SGX:CY6U) by estimating the company's future cash flows and discounting them to their present value. We will use the Discounted Cash Flow (DCF) model on this occasion. Believe it or not, it's not too difficult to follow, as you'll see from our example!
We would caution that there are many ways of valuing a company and, like the DCF, each technique has advantages and disadvantages in certain scenarios. If you still have some burning questions about this type of valuation, take a look at the Simply Wall St analysis model.
See our latest analysis for CapitaLand India Trust
The Model
As CapitaLand India Trust operates in the real estate sector, we need to calculate the intrinsic value slightly differently. Instead of using free cash flows, which are hard to estimate and often not reported by analysts in this industry, dividends per share (DPS) payments are used. Unless a company pays out the majority of its FCF as a dividend, this method will typically underestimate the value of the stock. The 'Gordon Growth Model' is used, which simply assumes that dividend payments will continue to increase at a sustainable growth rate forever. For a number of reasons a very conservative growth rate is used that cannot exceed that of a company's Gross Domestic Product (GDP). In this case we used the 5-year average of the 10-year government bond yield (2.2%). The expected dividend per share is then discounted to today's value at a cost of equity of 7.6%. Relative to the current share price of S$1.1, the company appears a touch undervalued at a 25% discount to where the stock price trades currently. The assumptions in any calculation have a big impact on the valuation, so it is better to view this as a rough estimate, not precise down to the last cent.
Value Per Share = Expected Dividend Per Share / (Discount Rate - Perpetual Growth Rate)
= S$0.08 / (7.6% – 2.2%)
= S$1.4
The Assumptions
We would point out that the most important inputs to a discounted cash flow are the discount rate and of course the actual cash flows. Part of investing is coming up with your own evaluation of a company's future performance, so try the calculation yourself and check your own assumptions. The DCF also does not consider the possible cyclicality of an industry, or a company's future capital requirements, so it does not give a full picture of a company's potential performance. Given that we are looking at CapitaLand India Trust as potential shareholders, the cost of equity is used as the discount rate, rather than the cost of capital (or weighted average cost of capital, WACC) which accounts for debt. In this calculation we've used 7.6%, which is based on a levered beta of 1.316. Beta is a measure of a stock's volatility, compared to the market as a whole. We get our beta from the industry average beta of globally comparable companies, with an imposed limit between 0.8 and 2.0, which is a reasonable range for a stable business.
SWOT Analysis for CapitaLand India Trust
- Earnings growth over the past year exceeded the industry.
- Debt is well covered by earnings.
- Dividends are covered by earnings and cash flows.
- Dividend is in the top 25% of dividend payers in the market.
- Dividend information for CY6U.
- No major weaknesses identified for CY6U.
- Annual revenue is forecast to grow faster than the Singaporean market.
- Good value based on P/E ratio and estimated fair value.
- Debt is not well covered by operating cash flow.
- Annual earnings are forecast to grow slower than the Singaporean market.
- Is CY6U well equipped to handle threats?
Moving On:
Valuation is only one side of the coin in terms of building your investment thesis, and it shouldn't be the only metric you look at when researching a company. It's not possible to obtain a foolproof valuation with a DCF model. Rather it should be seen as a guide to "what assumptions need to be true for this stock to be under/overvalued?" If a company grows at a different rate, or if its cost of equity or risk free rate changes sharply, the output can look very different. Why is the intrinsic value higher than the current share price? For CapitaLand India Trust, there are three essential factors you should further examine:
- Risks: Every company has them, and we've spotted 3 warning signs for CapitaLand India Trust (of which 1 is a bit unpleasant!) you should know about.
- Future Earnings: How does CY6U's growth rate compare to its peers and the wider market? Dig deeper into the analyst consensus number for the upcoming years by interacting with our free analyst growth expectation chart.
- Other High Quality Alternatives: Do you like a good all-rounder? Explore our interactive list of high quality stocks to get an idea of what else is out there you may be missing!
PS. The Simply Wall St app conducts a discounted cash flow valuation for every stock on the SGX every day. If you want to find the calculation for other stocks just search here.
New: AI Stock Screener & Alerts
Our new AI Stock Screener scans the market every day to uncover opportunities.
• Dividend Powerhouses (3%+ Yield)• Undervalued Small Caps with Insider Buying• High growth Tech and AI CompaniesOr build your own from over 50 metrics.
Explore Now for FreeHave feedback on this article? Concerned about the content? Get in touch with us directly. Alternatively, email editorial-team (at) simplywallst.com.This article by Simply Wall St is general in nature. We provide commentary based on historical data and analyst forecasts only using an unbiased methodology and our articles are not intended to be financial advice. It does not constitute a recommendation to buy or sell any stock, and does not take account of your objectives, or your financial situation. We aim to bring you long-term focused analysis driven by fundamental data. Note that our analysis may not factor in the latest price-sensitive company announcements or qualitative material. Simply Wall St has no position in any stocks mentioned.
免責聲明:投資有風險,本文並非投資建議,以上內容不應被視為任何金融產品的購買或出售要約、建議或邀請,作者或其他用戶的任何相關討論、評論或帖子也不應被視為此類內容。本文僅供一般參考,不考慮您的個人投資目標、財務狀況或需求。TTM對信息的準確性和完整性不承擔任何責任或保證,投資者應自行研究並在投資前尋求專業建議。
熱議股票
- 1
- 2
- 3
- 4
- 5
- 6
- 7
- 8
- 9
- 10