Here's Why Luye Pharma Group (HKG:2186) Has A Meaningful Debt Burden
Legendary fund manager Li Lu (who Charlie Munger backed) once said, 'The biggest investment risk is not the volatility of prices, but whether you will suffer a permanent loss of capital.' So it seems the smart money knows that debt - which is usually involved in bankruptcies - is a very important factor, when you assess how risky a company is. We can see that Luye Pharma Group Ltd. (HKG:2186) does use debt in its business. But the real question is whether this debt is making the company risky.
When Is Debt Dangerous?
Generally speaking, debt only becomes a real problem when a company can't easily pay it off, either by raising capital or with its own cash flow. Ultimately, if the company can't fulfill its legal obligations to repay debt, shareholders could walk away with nothing. However, a more common (but still painful) scenario is that it has to raise new equity capital at a low price, thus permanently diluting shareholders. Of course, the upside of debt is that it often represents cheap capital, especially when it replaces dilution in a company with the ability to reinvest at high rates of return. When we examine debt levels, we first consider both cash and debt levels, together.
See our latest analysis for Luye Pharma Group
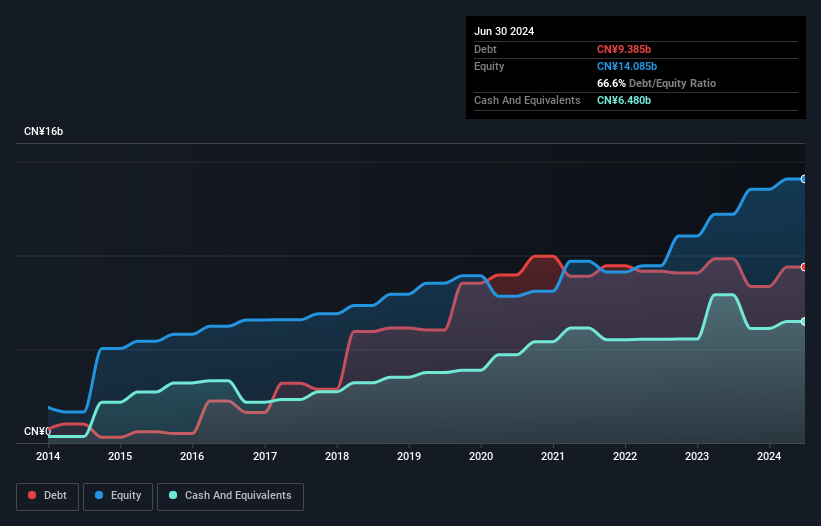
How Much Debt Does Luye Pharma Group Carry?
You can click the graphic below for the historical numbers, but it shows that Luye Pharma Group had CN¥9.39b of debt in June 2024, down from CN¥9.83b, one year before. However, it also had CN¥6.48b in cash, and so its net debt is CN¥2.91b.
How Healthy Is Luye Pharma Group's Balance Sheet?
Zooming in on the latest balance sheet data, we can see that Luye Pharma Group had liabilities of CN¥9.77b due within 12 months and liabilities of CN¥3.34b due beyond that. Offsetting these obligations, it had cash of CN¥6.48b as well as receivables valued at CN¥3.56b due within 12 months. So its liabilities total CN¥3.07b more than the combination of its cash and short-term receivables.
Luye Pharma Group has a market capitalization of CN¥7.55b, so it could very likely raise cash to ameliorate its balance sheet, if the need arose. But it's clear that we should definitely closely examine whether it can manage its debt without dilution.
We use two main ratios to inform us about debt levels relative to earnings. The first is net debt divided by earnings before interest, tax, depreciation, and amortization (EBITDA), while the second is how many times its earnings before interest and tax (EBIT) covers its interest expense (or its interest cover, for short). This way, we consider both the absolute quantum of the debt, as well as the interest rates paid on it.
While Luye Pharma Group's low debt to EBITDA ratio of 1.5 suggests only modest use of debt, the fact that EBIT only covered the interest expense by 2.9 times last year does give us pause. So we'd recommend keeping a close eye on the impact financing costs are having on the business. Notably, Luye Pharma Group's EBIT launched higher than Elon Musk, gaining a whopping 134% on last year. There's no doubt that we learn most about debt from the balance sheet. But it is future earnings, more than anything, that will determine Luye Pharma Group's ability to maintain a healthy balance sheet going forward. So if you're focused on the future you can check out this free report showing analyst profit forecasts.
Finally, a company can only pay off debt with cold hard cash, not accounting profits. So we clearly need to look at whether that EBIT is leading to corresponding free cash flow. Over the last three years, Luye Pharma Group saw substantial negative free cash flow, in total. While that may be a result of expenditure for growth, it does make the debt far more risky.
Our View
Neither Luye Pharma Group's ability to convert EBIT to free cash flow nor its interest cover gave us confidence in its ability to take on more debt. But the good news is it seems to be able to grow its EBIT with ease. Looking at all the angles mentioned above, it does seem to us that Luye Pharma Group is a somewhat risky investment as a result of its debt. Not all risk is bad, as it can boost share price returns if it pays off, but this debt risk is worth keeping in mind. Above most other metrics, we think its important to track how fast earnings per share is growing, if at all. If you've also come to that realization, you're in luck, because today you can view this interactive graph of Luye Pharma Group's earnings per share history for free.
If you're interested in investing in businesses that can grow profits without the burden of debt, then check out this free list of growing businesses that have net cash on the balance sheet.
New: AI Stock Screener & Alerts
Our new AI Stock Screener scans the market every day to uncover opportunities.
• Dividend Powerhouses (3%+ Yield)• Undervalued Small Caps with Insider Buying• High growth Tech and AI CompaniesOr build your own from over 50 metrics.
Explore Now for FreeHave feedback on this article? Concerned about the content? Get in touch with us directly. Alternatively, email editorial-team (at) simplywallst.com.This article by Simply Wall St is general in nature. We provide commentary based on historical data and analyst forecasts only using an unbiased methodology and our articles are not intended to be financial advice. It does not constitute a recommendation to buy or sell any stock, and does not take account of your objectives, or your financial situation. We aim to bring you long-term focused analysis driven by fundamental data. Note that our analysis may not factor in the latest price-sensitive company announcements or qualitative material. Simply Wall St has no position in any stocks mentioned.
免責聲明:投資有風險,本文並非投資建議,以上內容不應被視為任何金融產品的購買或出售要約、建議或邀請,作者或其他用戶的任何相關討論、評論或帖子也不應被視為此類內容。本文僅供一般參考,不考慮您的個人投資目標、財務狀況或需求。TTM對信息的準確性和完整性不承擔任何責任或保證,投資者應自行研究並在投資前尋求專業建議。
熱議股票
- 1
- 2
- 3
- 4
- 5
- 6
- 7
- 8
- 9
- 10