A Look At The Fair Value Of China Overseas Grand Oceans Group Limited (HKG:81)
Key Insights
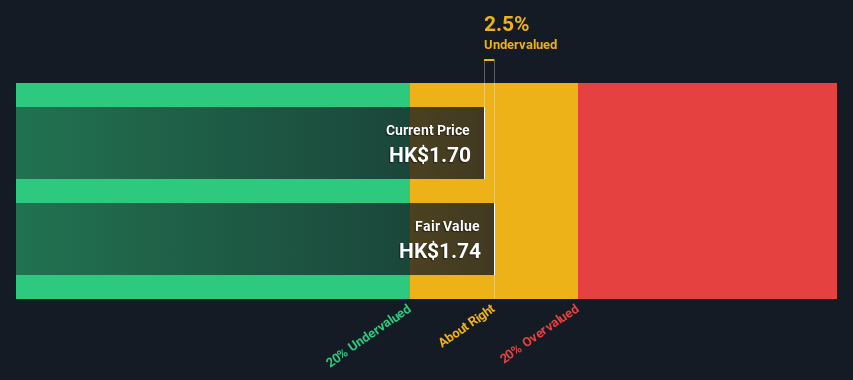
- The projected fair value for China Overseas Grand Oceans Group is HK$1.74 based on Dividend Discount Model
- China Overseas Grand Oceans Group's HK$1.70 share price indicates it is trading at similar levels as its fair value estimate
- Analyst price target for 81 is CN¥2.45, which is 40% above our fair value estimate
Today we'll do a simple run through of a valuation method used to estimate the attractiveness of China Overseas Grand Oceans Group Limited (HKG:81) as an investment opportunity by projecting its future cash flows and then discounting them to today's value. We will take advantage of the Discounted Cash Flow (DCF) model for this purpose. There's really not all that much to it, even though it might appear quite complex.
Companies can be valued in a lot of ways, so we would point out that a DCF is not perfect for every situation. If you want to learn more about discounted cash flow, the rationale behind this calculation can be read in detail in the Simply Wall St analysis model.
View our latest analysis for China Overseas Grand Oceans Group
The Method
We have to calculate the value of China Overseas Grand Oceans Group slightly differently to other stocks because it is a real estate company. Instead of using free cash flows, which are hard to estimate and often not reported by analysts in this industry, dividends per share (DPS) payments are used. Unless a company pays out the majority of its FCF as a dividend, this method will typically underestimate the value of the stock. We use the Gordon Growth Model, which assumes dividend will grow into perpetuity at a rate that can be sustained. The dividend is expected to grow at an annual growth rate equal to the 5-year average of the 10-year government bond yield of 2.3%. We then discount this figure to today's value at a cost of equity of 8.7%. Relative to the current share price of HK$1.7, the company appears about fair value at a 2.5% discount to where the stock price trades currently. The assumptions in any calculation have a big impact on the valuation, so it is better to view this as a rough estimate, not precise down to the last cent.
Value Per Share = Expected Dividend Per Share / (Discount Rate - Perpetual Growth Rate)
= CN¥0.1 / (8.7% – 2.3%)
= HK$1.7
The Assumptions
We would point out that the most important inputs to a discounted cash flow are the discount rate and of course the actual cash flows. You don't have to agree with these inputs, I recommend redoing the calculations yourself and playing with them. The DCF also does not consider the possible cyclicality of an industry, or a company's future capital requirements, so it does not give a full picture of a company's potential performance. Given that we are looking at China Overseas Grand Oceans Group as potential shareholders, the cost of equity is used as the discount rate, rather than the cost of capital (or weighted average cost of capital, WACC) which accounts for debt. In this calculation we've used 8.7%, which is based on a levered beta of 1.317. Beta is a measure of a stock's volatility, compared to the market as a whole. We get our beta from the industry average beta of globally comparable companies, with an imposed limit between 0.8 and 2.0, which is a reasonable range for a stable business.
SWOT Analysis for China Overseas Grand Oceans Group
- Debt is well covered by earnings.
- Dividends are covered by earnings and cash flows.
- Dividend information for 81.
- Earnings declined over the past year.
- Dividend is low compared to the top 25% of dividend payers in the Real Estate market.
- Annual earnings are forecast to grow for the next 3 years.
- Good value based on P/E ratio and estimated fair value.
- Debt is not well covered by operating cash flow.
- Annual earnings are forecast to grow slower than the Hong Kong market.
- Is 81 well equipped to handle threats?
Next Steps:
Although the valuation of a company is important, it shouldn't be the only metric you look at when researching a company. DCF models are not the be-all and end-all of investment valuation. Preferably you'd apply different cases and assumptions and see how they would impact the company's valuation. For instance, if the terminal value growth rate is adjusted slightly, it can dramatically alter the overall result. For China Overseas Grand Oceans Group, there are three further factors you should look at:
- Risks: Be aware that China Overseas Grand Oceans Group is showing 4 warning signs in our investment analysis , and 1 of those is concerning...
- Future Earnings: How does 81's growth rate compare to its peers and the wider market? Dig deeper into the analyst consensus number for the upcoming years by interacting with our free analyst growth expectation chart.
- Other Solid Businesses: Low debt, high returns on equity and good past performance are fundamental to a strong business. Why not explore our interactive list of stocks with solid business fundamentals to see if there are other companies you may not have considered!
PS. The Simply Wall St app conducts a discounted cash flow valuation for every stock on the SEHK every day. If you want to find the calculation for other stocks just search here.
New: AI Stock Screener & Alerts
Our new AI Stock Screener scans the market every day to uncover opportunities.
• Dividend Powerhouses (3%+ Yield)• Undervalued Small Caps with Insider Buying• High growth Tech and AI CompaniesOr build your own from over 50 metrics.
Explore Now for FreeHave feedback on this article? Concerned about the content? Get in touch with us directly. Alternatively, email editorial-team (at) simplywallst.com.This article by Simply Wall St is general in nature. We provide commentary based on historical data and analyst forecasts only using an unbiased methodology and our articles are not intended to be financial advice. It does not constitute a recommendation to buy or sell any stock, and does not take account of your objectives, or your financial situation. We aim to bring you long-term focused analysis driven by fundamental data. Note that our analysis may not factor in the latest price-sensitive company announcements or qualitative material. Simply Wall St has no position in any stocks mentioned.
免責聲明:投資有風險,本文並非投資建議,以上內容不應被視為任何金融產品的購買或出售要約、建議或邀請,作者或其他用戶的任何相關討論、評論或帖子也不應被視為此類內容。本文僅供一般參考,不考慮您的個人投資目標、財務狀況或需求。TTM對信息的準確性和完整性不承擔任何責任或保證,投資者應自行研究並在投資前尋求專業建議。
熱議股票
- 1
- 2
- 3
- 4
- 5
- 6
- 7
- 8
- 9
- 10