Investing in Nordson (NASDAQ:NDSN) five years ago would have delivered you a 35% gain
While Nordson Corporation (NASDAQ:NDSN) shareholders are probably generally happy, the stock hasn't had particularly good run recently, with the share price falling 19% in the last quarter. On the bright side the share price is up over the last half decade. However we are not very impressed because the share price is only up 28%, less than the market return of 98%.
Now it's worth having a look at the company's fundamentals too, because that will help us determine if the long term shareholder return has matched the performance of the underlying business.
Check out our latest analysis for Nordson
To paraphrase Benjamin Graham: Over the short term the market is a voting machine, but over the long term it's a weighing machine. One flawed but reasonable way to assess how sentiment around a company has changed is to compare the earnings per share (EPS) with the share price.
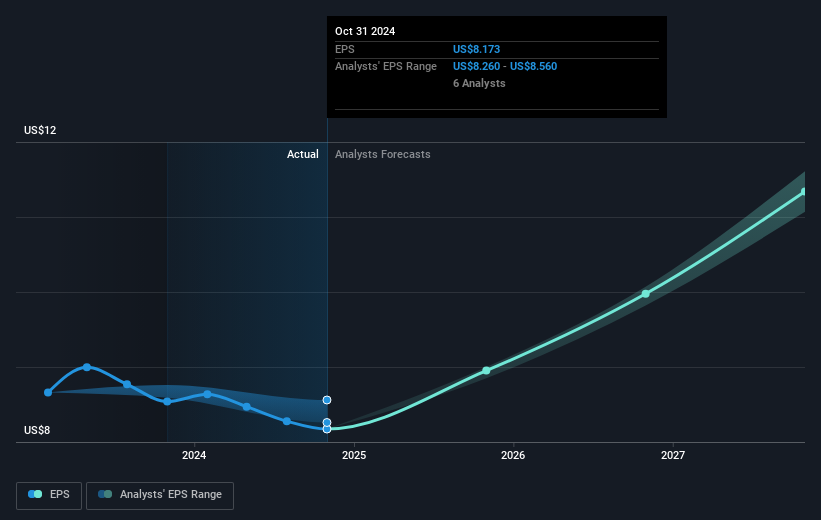
Over half a decade, Nordson managed to grow its earnings per share at 6.9% a year. This EPS growth is higher than the 5% average annual increase in the share price. So it seems the market isn't so enthusiastic about the stock these days.
The graphic below depicts how EPS has changed over time (unveil the exact values by clicking on the image).
It's probably worth noting that the CEO is paid less than the median at similar sized companies. But while CEO remuneration is always worth checking, the really important question is whether the company can grow earnings going forward. This free interactive report on Nordson's earnings, revenue and cash flow is a great place to start, if you want to investigate the stock further.
What About Dividends?
It is important to consider the total shareholder return, as well as the share price return, for any given stock. The TSR incorporates the value of any spin-offs or discounted capital raisings, along with any dividends, based on the assumption that the dividends are reinvested. So for companies that pay a generous dividend, the TSR is often a lot higher than the share price return. In the case of Nordson, it has a TSR of 35% for the last 5 years. That exceeds its share price return that we previously mentioned. And there's no prize for guessing that the dividend payments largely explain the divergence!
A Different Perspective
While the broader market gained around 26% in the last year, Nordson shareholders lost 19% (even including dividends). Even the share prices of good stocks drop sometimes, but we want to see improvements in the fundamental metrics of a business, before getting too interested. On the bright side, long term shareholders have made money, with a gain of 6% per year over half a decade. If the fundamental data continues to indicate long term sustainable growth, the current sell-off could be an opportunity worth considering. It's always interesting to track share price performance over the longer term. But to understand Nordson better, we need to consider many other factors. Even so, be aware that Nordson is showing 1 warning sign in our investment analysis , you should know about...
But note: Nordson may not be the best stock to buy. So take a peek at this free list of interesting companies with past earnings growth (and further growth forecast).
Please note, the market returns quoted in this article reflect the market weighted average returns of stocks that currently trade on American exchanges.
Valuation is complex, but we're here to simplify it.
Discover if Nordson might be undervalued or overvalued with our detailed analysis, featuring fair value estimates, potential risks, dividends, insider trades, and its financial condition.
Access Free AnalysisHave feedback on this article? Concerned about the content? Get in touch with us directly. Alternatively, email editorial-team (at) simplywallst.com.This article by Simply Wall St is general in nature. We provide commentary based on historical data and analyst forecasts only using an unbiased methodology and our articles are not intended to be financial advice. It does not constitute a recommendation to buy or sell any stock, and does not take account of your objectives, or your financial situation. We aim to bring you long-term focused analysis driven by fundamental data. Note that our analysis may not factor in the latest price-sensitive company announcements or qualitative material. Simply Wall St has no position in any stocks mentioned.
免責聲明:投資有風險,本文並非投資建議,以上內容不應被視為任何金融產品的購買或出售要約、建議或邀請,作者或其他用戶的任何相關討論、評論或帖子也不應被視為此類內容。本文僅供一般參考,不考慮您的個人投資目標、財務狀況或需求。TTM對信息的準確性和完整性不承擔任何責任或保證,投資者應自行研究並在投資前尋求專業建議。
熱議股票
- 1
- 2
- 3
- 4
- 5
- 6
- 7
- 8
- 9
- 10