Hedera (HBAR) Price Risks Further Drop With Death Cross Looming
- Hedera (HBAR) price rises 59% in 30 days but faces weakening momentum, with ADX at 18.2 signaling a weak downtrend.
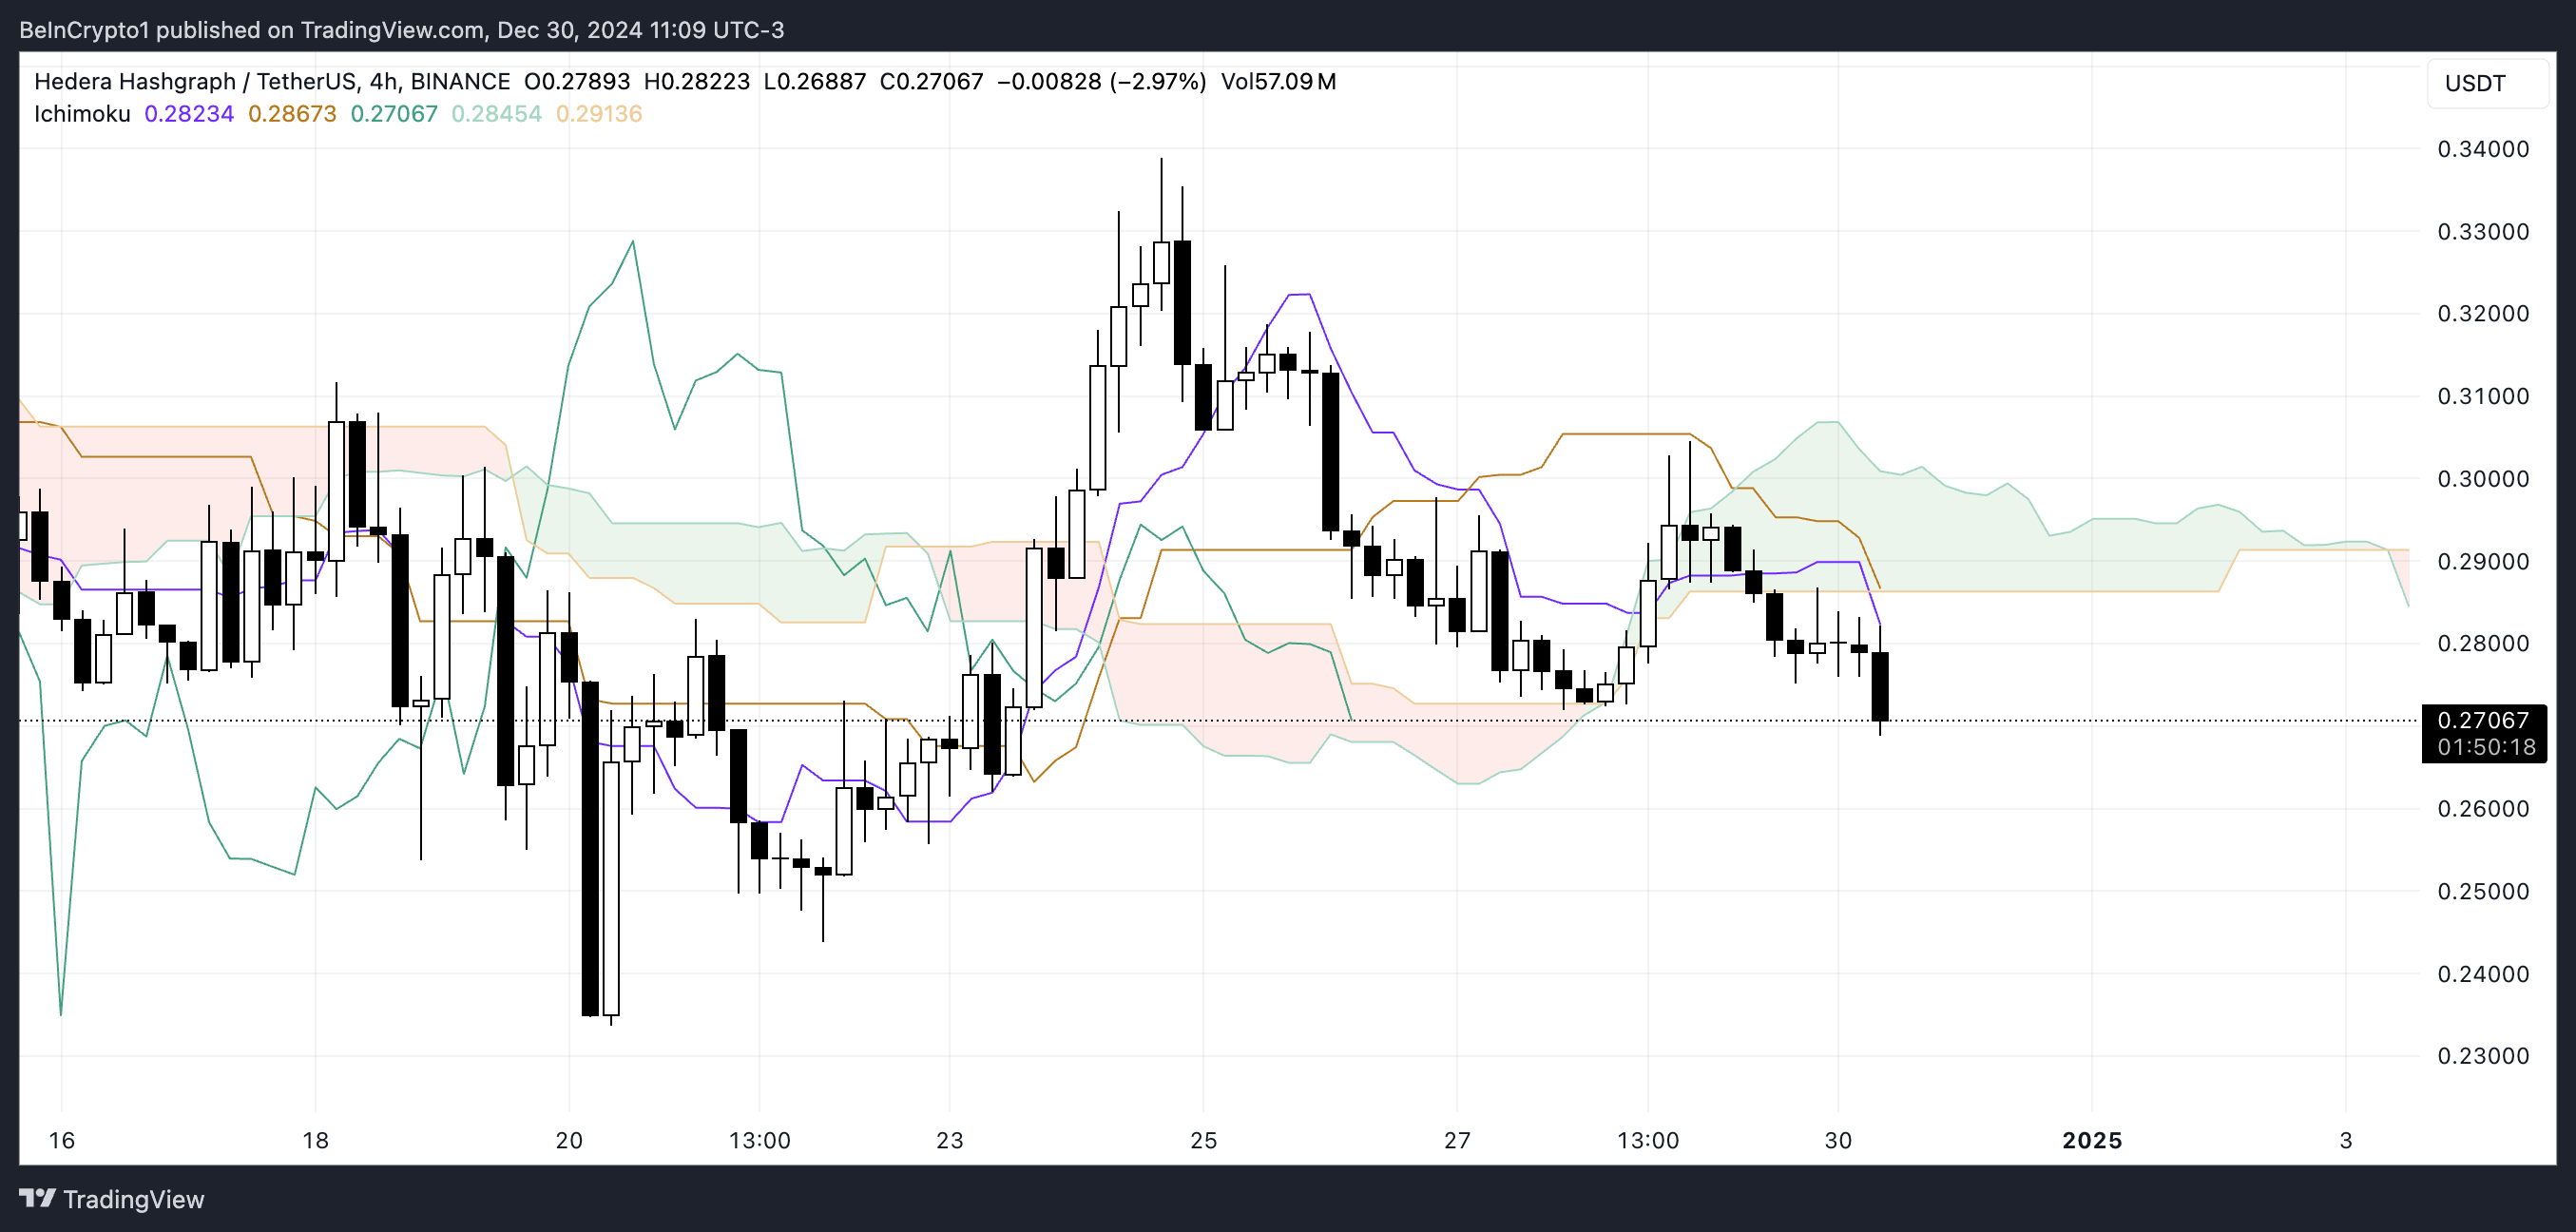
- Ichimoku Cloud shows bearish conditions, with HBAR trading below the red cloud and indicators reflecting ongoing downward pressure.
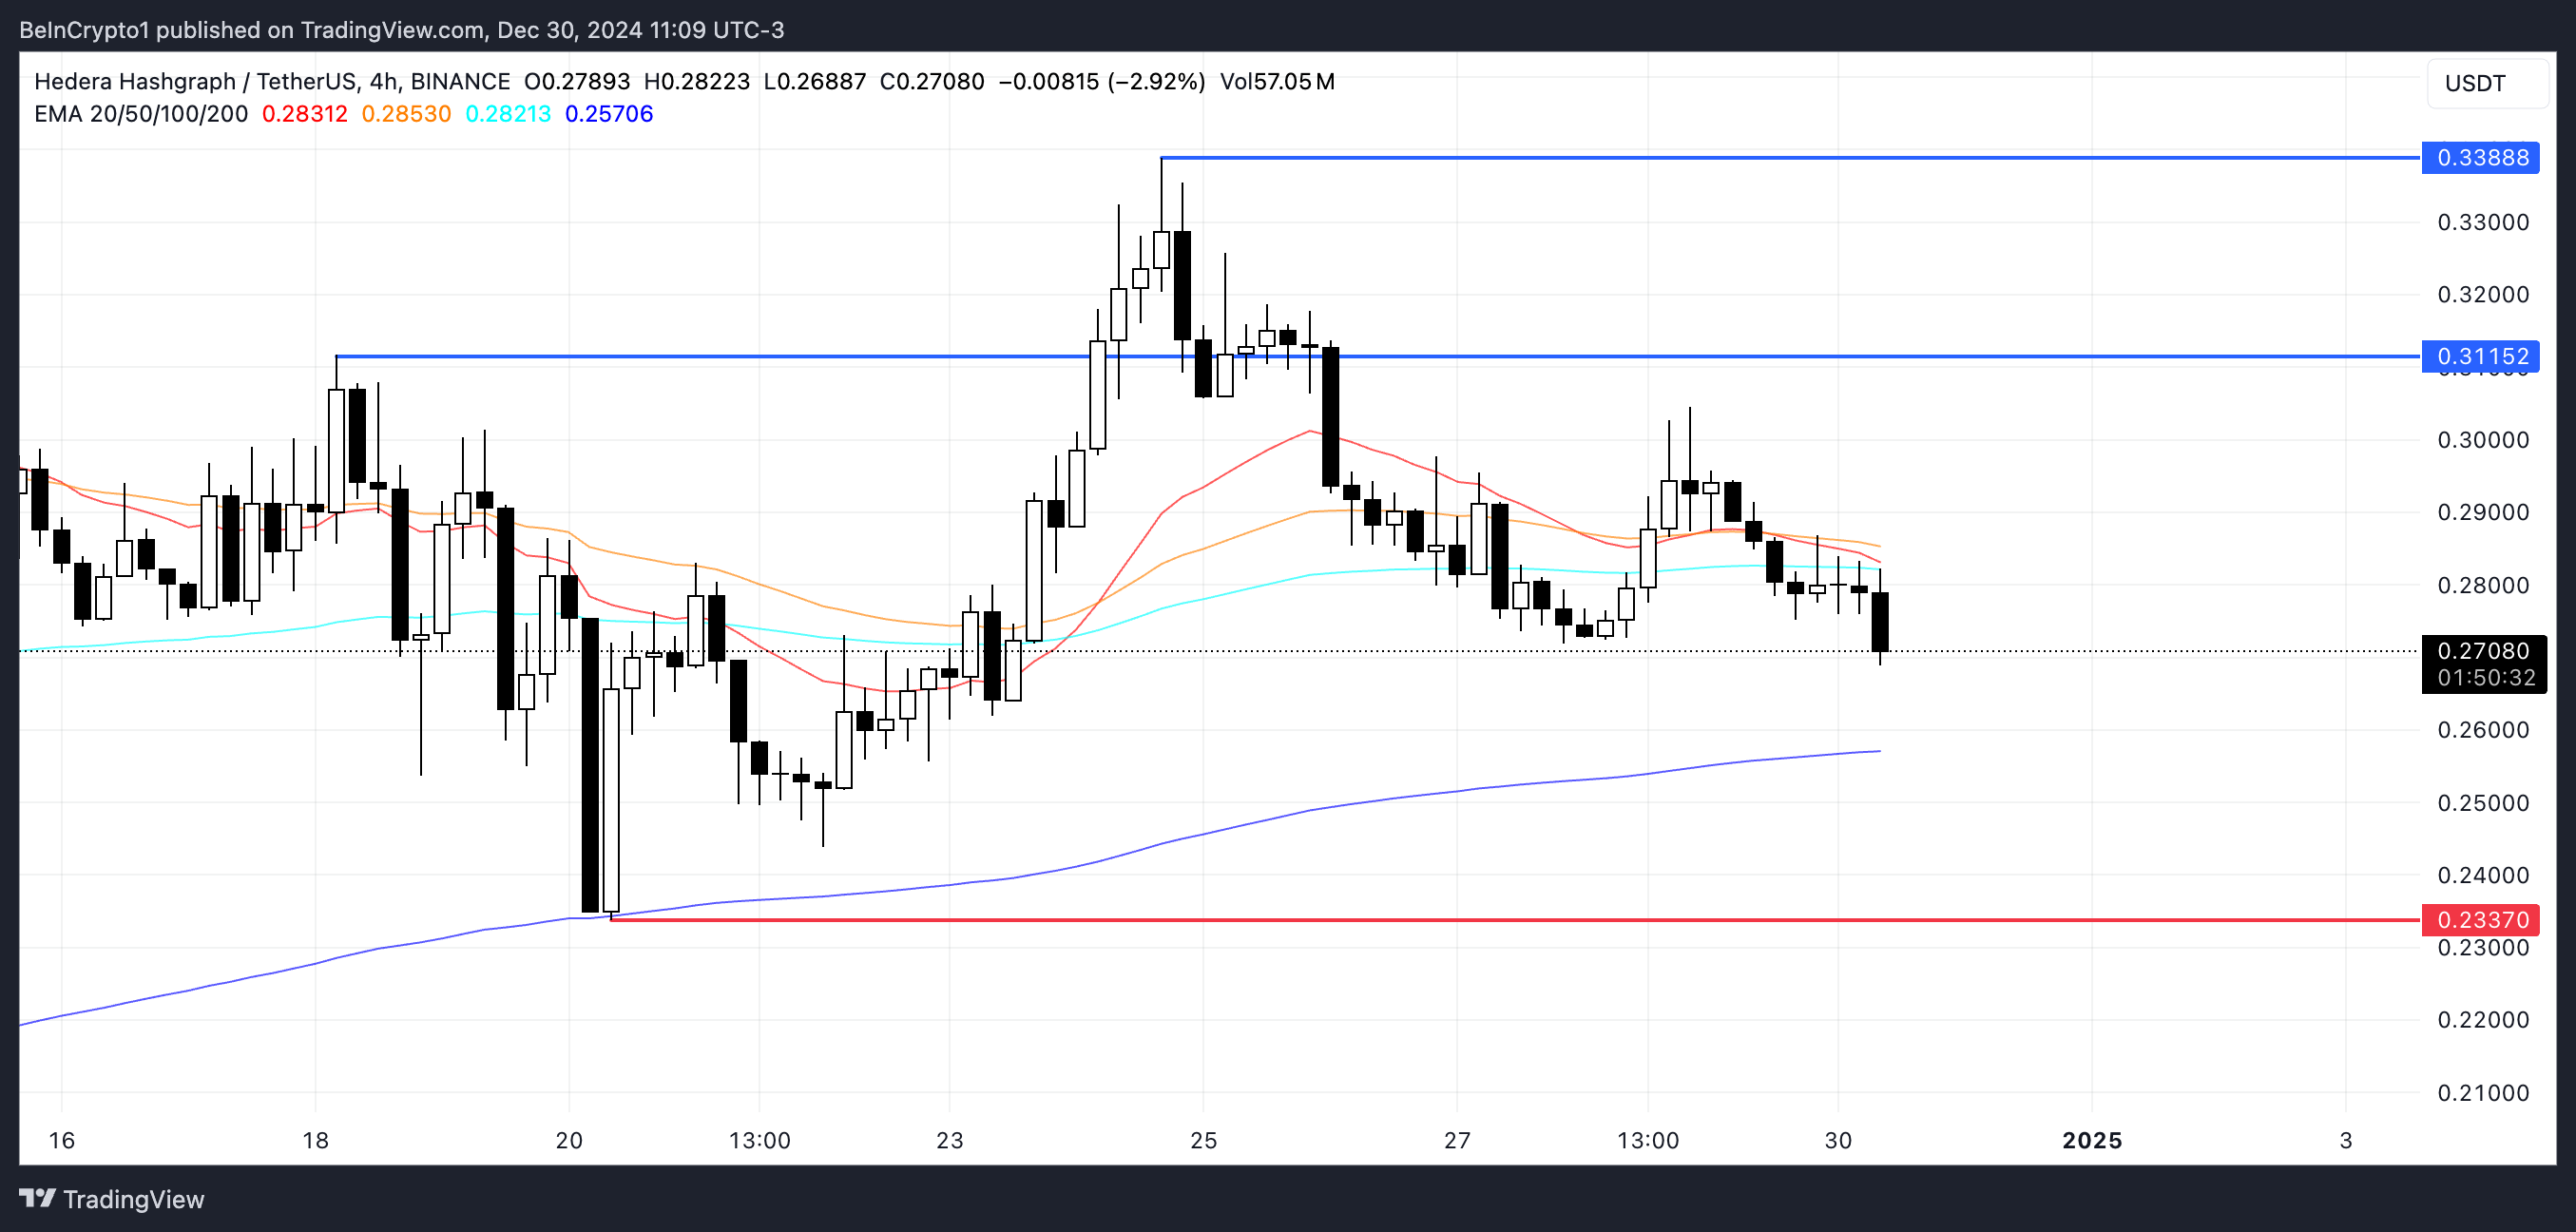
- Key levels include $0.233 support and $0.31 resistance; breaking these zones will determine HBAR’s next direction.
Hedera (HBAR) price reached multiple highs in December but has now fallen more than 4% in the last 24 hours.
Although several indicators suggest the correction may end soon, a looming death cross threatens to deepen the decline.
HBAR Is Still In a Downtrend
Hedera DMI chart reveals that its ADX is currently at 18.2, indicating weak trend strength. The +DI (Directional Indicator) stands at 18.8, while the -DI is slightly higher at 19.3, showing that bearish momentum remains slightly dominant.
This setup shows that HBAR is still in a downtrend, but the lack of a strong ADX suggests the trend is not firmly established, leaving room for potential shifts in market direction.

The Average Directional Index (ADX) measures the strength of a trend on a scale of 0 to 100, regardless of its direction. Values above 25 indicate a strong trend, while readings below 20, like HBAR current 18.2, suggest weak or absent trend strength. The close proximity of +DI and -DI indicates that neither buyers nor sellers are exerting significant control.
For the short term, HBAR price may remain range-bound or show limited movement unless one side gains a clear advantage, accompanied by a rising ADX to confirm stronger trend momentum.
Ichimoku Cloud Hints at Further Decline
The Ichimoku Cloud chart for Hedera indicates a bearish setup, with the price positioned below the red cloud. The red color of the cloud, formed by Senkou Span A and Senkou Span B, reflects bearish momentum as Senkou Span A remains below Senkou Span B. This configuration suggests that downward pressure persists in the market, keeping HBAR under a bearish influence.

Additionally, the purple Tenkan-sen (conversion line) is below the orange Kijun-sen (baseline), reinforcing the bearish sentiment as short-term momentum trails behind the longer-term trend.
The green lagging span (Chikou Span) is also below the price action and the cloud, further confirming the dominance of bearish conditions. Overall, the Ichimoku setup indicates that HBAR is likely to remain in a downtrend unless it can break above the cloud, signaling a potential reversal.
HBAR Price Prediction: Will Hedera Fall 13.7% Next?
If the current downtrend in HBAR price persists and strengthens, the price could fall further to test the support level at $0.233. That could happen if the short-term line (red line) crossed below the long-term one (light blue line), forming a death cross. A failure to hold this support could signal increased bearish momentum, potentially driving the price lower.

On the other hand, if the trend reverses and short-term lines crossed above long-term ones, HBAR price could attempt a recovery.
In such a case, the price might test the resistance at $0.31, and a successful breakout above this level could pave the way for a move toward $0.33. A bullish reversal of this nature would signal renewed buying interest and potential momentum for further upside.
免責聲明:投資有風險,本文並非投資建議,以上內容不應被視為任何金融產品的購買或出售要約、建議或邀請,作者或其他用戶的任何相關討論、評論或帖子也不應被視為此類內容。本文僅供一般參考,不考慮您的個人投資目標、財務狀況或需求。TTM對信息的準確性和完整性不承擔任何責任或保證,投資者應自行研究並在投資前尋求專業建議。
熱議股票
- 1
- 2
- 3
- 4
- 5
- 6
- 7
- 8
- 9
- 10