FARTCOIN’s 27% Gains Face New Threats from Rising Market Volatility
- FARTCOIN surges 27% to a record $1.47, fueled by bullish sentiment, but now faces risks of heightened market volatility.
- Technical indicators warn of correction, with the Bollinger Bands signaling overbought conditions and ATR hitting a high of 0.24.
- The price outlook remains uncertain as increased volatility could trigger sharp upward or downward price movements in the short term.
Meme coin FARTCOIN has seen its value skyrocket by 27% over the past week. This bullish run culminated on January 2, with the token reaching a new all-time high of $1.47 during the day’s trading session.
However, this surge has come at a price: heightened market volatility now threatens the meme coin’s further gains.
FARTCOIN’s Gains at Risk Amid Surging Volatility
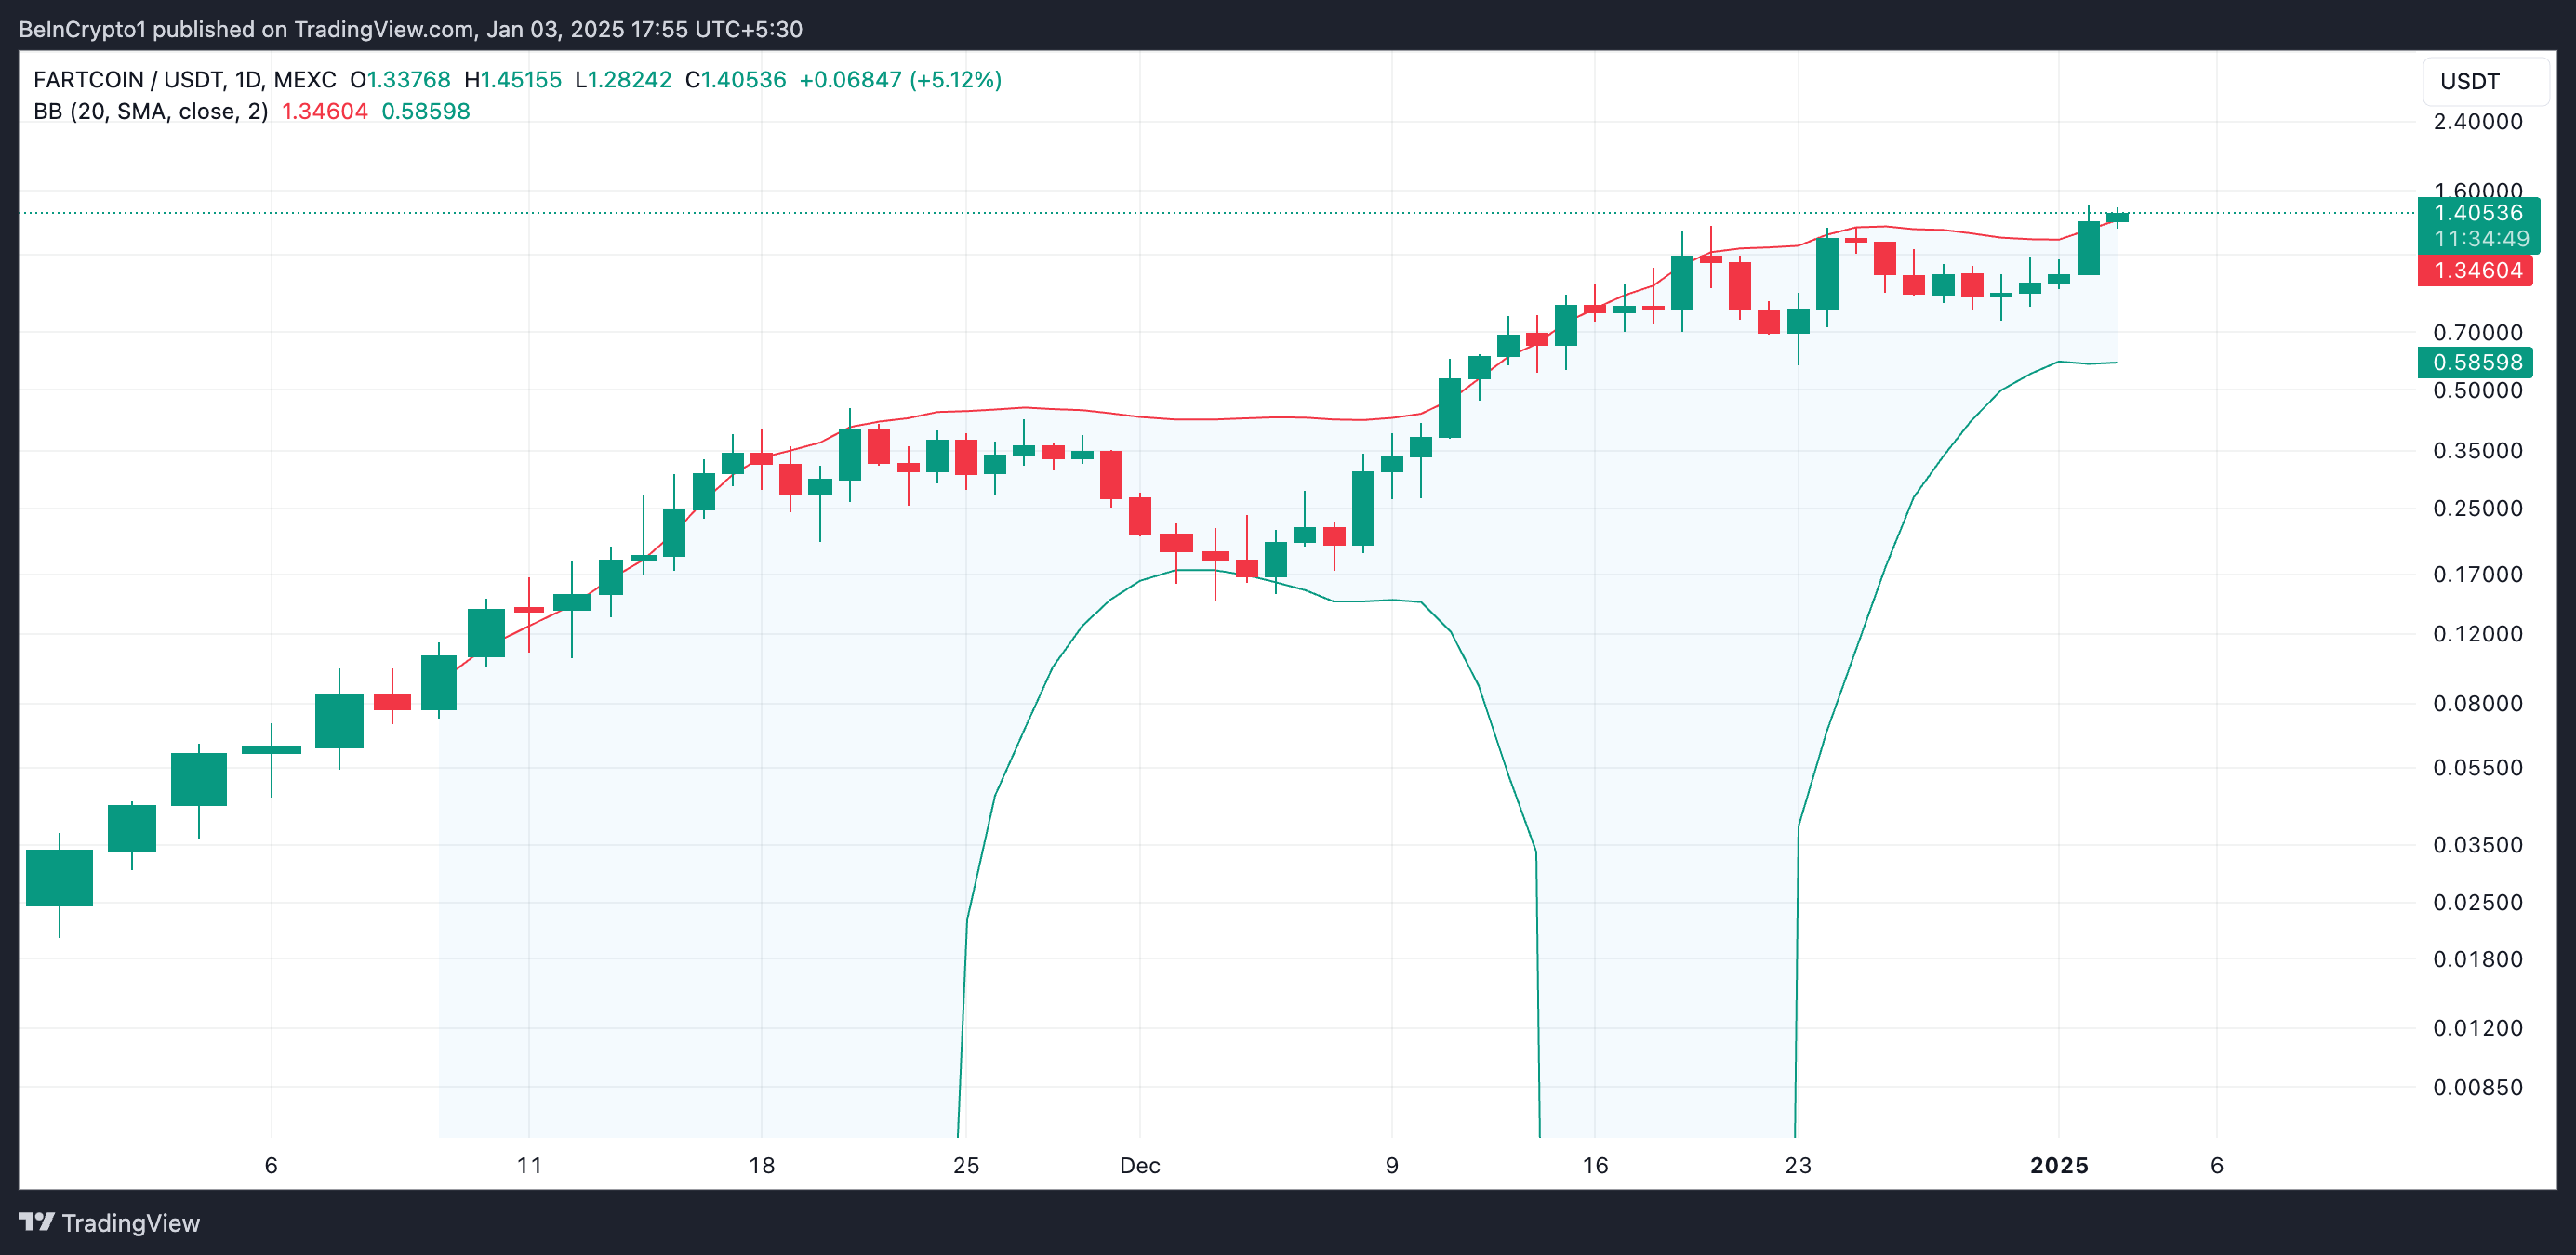
BeInCrypto’s assessment of the FARTCOIN/USD one-day chart shows that the altcoin now trades above the upper line of its Bollinger Bands Indicator.
This indicator measures an asset’s price volatility and identifies overbought or oversold conditions. It consists of three lines: a simple moving average (middle band) and two bands (upper and lower) representing standard deviations above and below the moving average.
When an asset’s price breaks above the upper band, it suggests a spike in volatility as its current value is moving significantly away from its average. It also indicates that the asset may be overbought and due for a price correction.
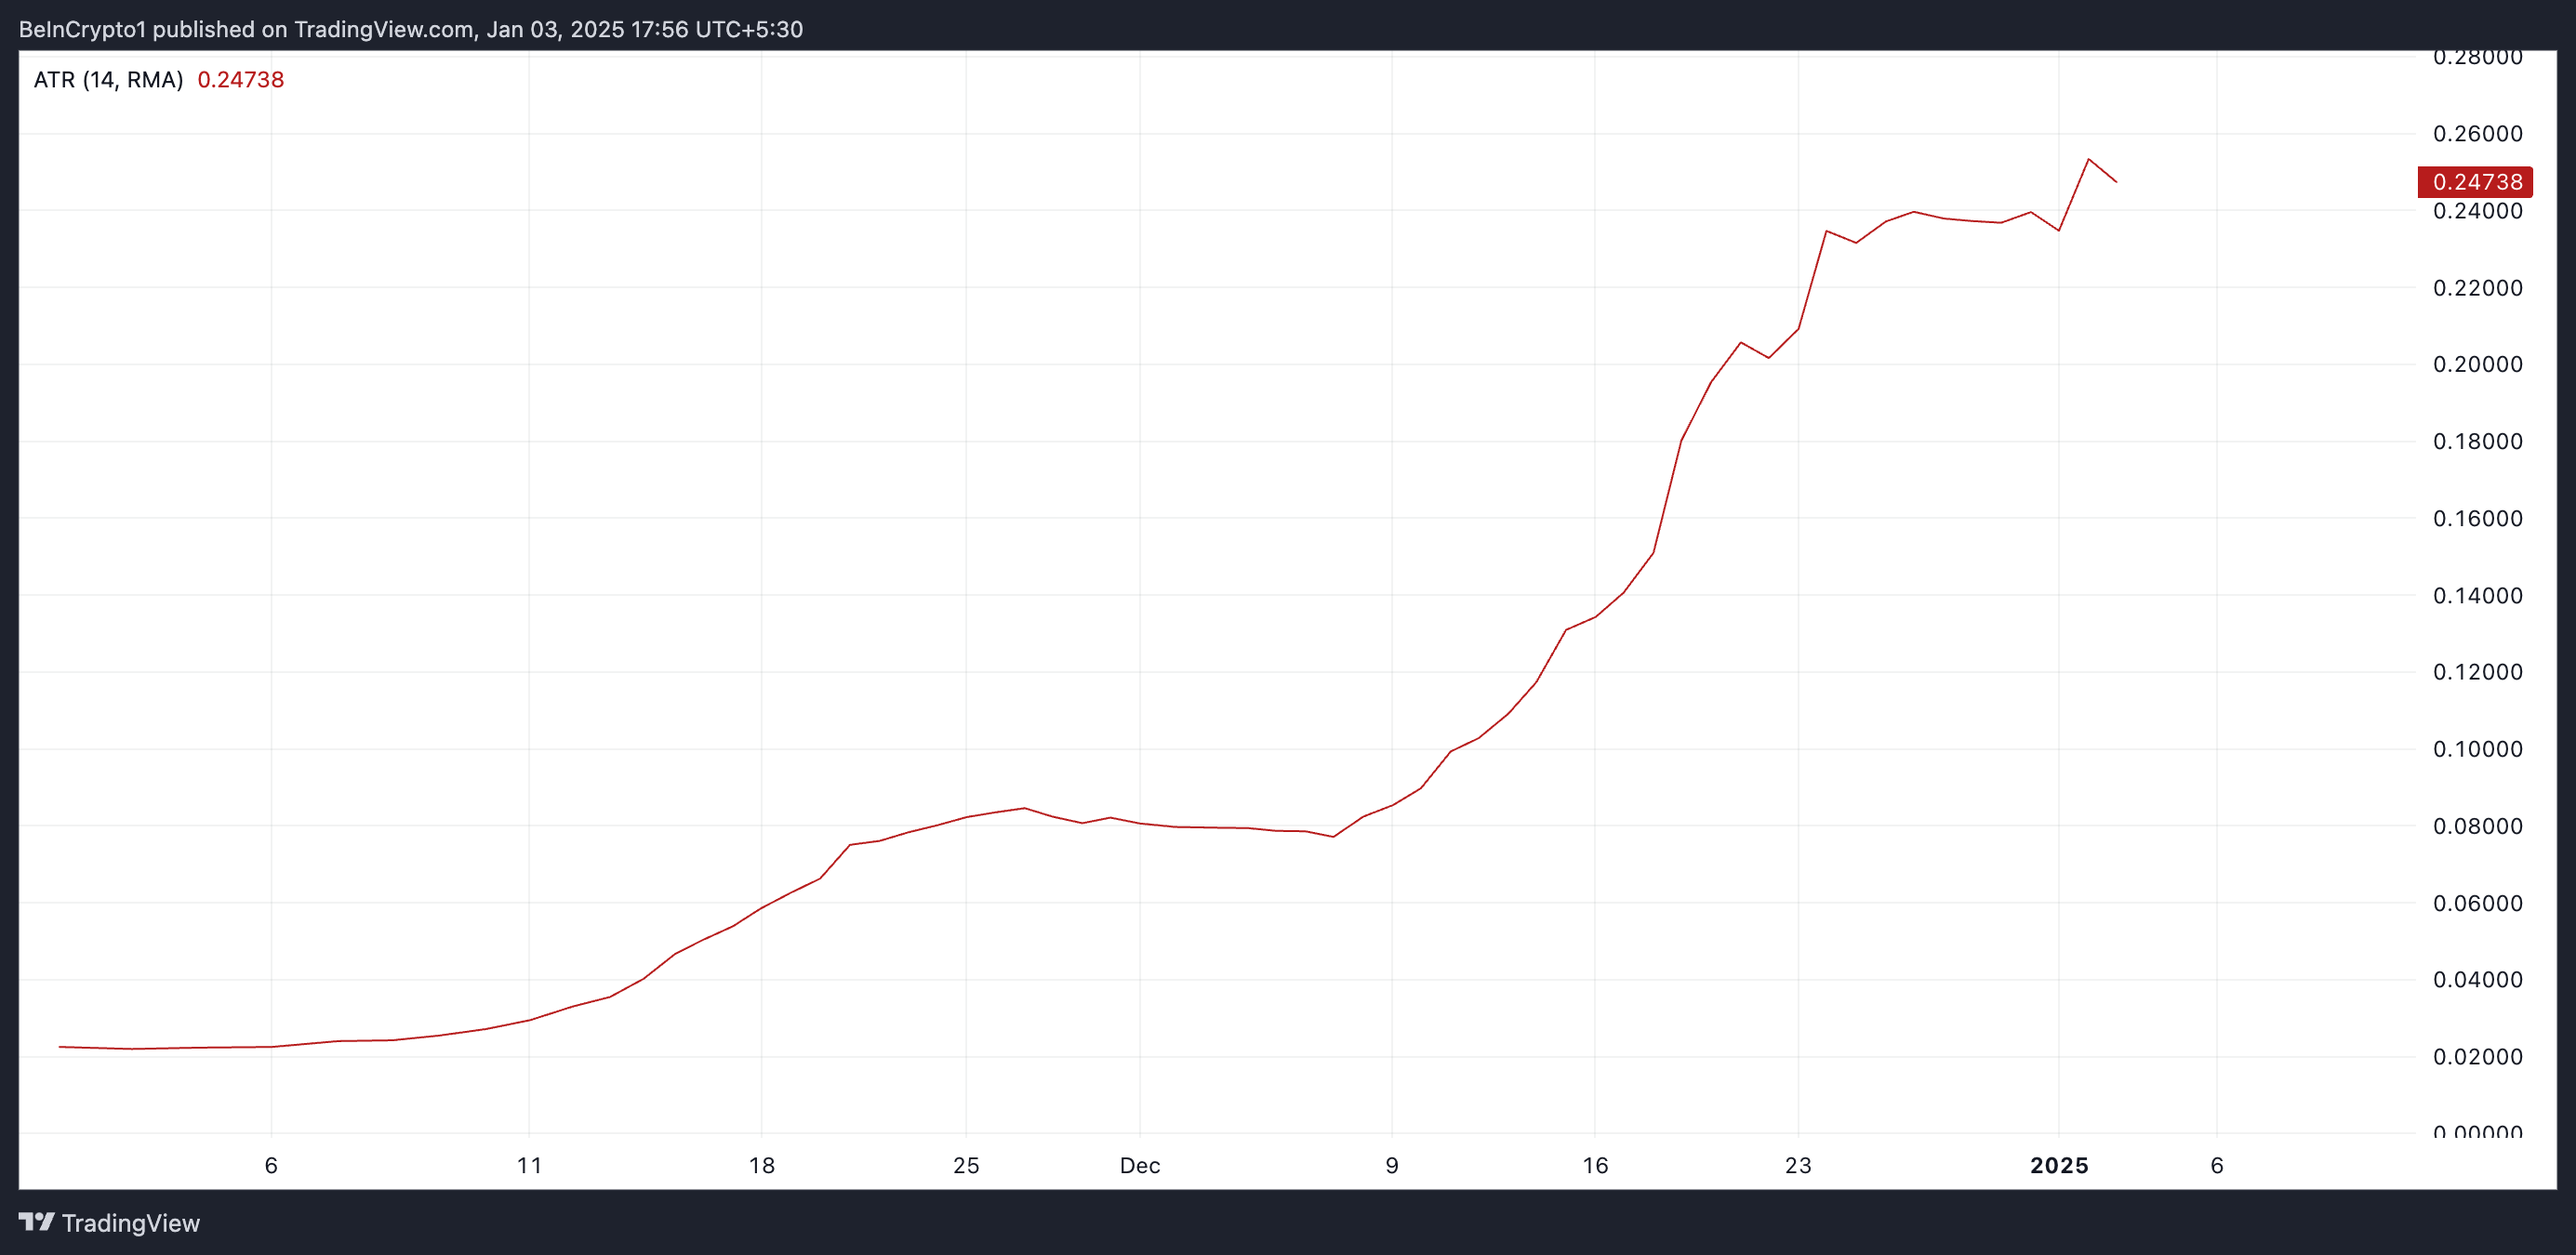
Additionally, FARTCOIN’s Average True Range (ATR) touched an all-time high of 0.25 on January 2, confirming the spike in market volatility. As of this writing, the indicator stands at 0.24.
The ATR is a volatility indicator that measures the average range between an asset’s high and low prices over a specified period. When it rises like this, it indicates a sudden increase in price movement, signifying heightened volatility in the market.
FARTCOIN Price Prediction: Key Levels to Watch
Generally, heightened market volatility increases the likelihood of large price movements, resulting in an asset’s price breaking out in either an upward or downward direction. Hence, if bullish pressure persists, FARTCOIN may break out in an uptrend, reclaim its all-time high of $1.47, and rally further.

On the other hand, if selling activity gains momentum, the meme coin’s price will break out in a downtrend and could fall to $0.53.
免責聲明:投資有風險,本文並非投資建議,以上內容不應被視為任何金融產品的購買或出售要約、建議或邀請,作者或其他用戶的任何相關討論、評論或帖子也不應被視為此類內容。本文僅供一般參考,不考慮您的個人投資目標、財務狀況或需求。TTM對信息的準確性和完整性不承擔任何責任或保證,投資者應自行研究並在投資前尋求專業建議。
熱議股票
- 1
- 2
- 3
- 4
- 5
- 6
- 7
- 8
- 9
- 10