Does Chart Industries (NYSE:GTLS) Have A Healthy Balance Sheet?
The external fund manager backed by Berkshire Hathaway's Charlie Munger, Li Lu, makes no bones about it when he says 'The biggest investment risk is not the volatility of prices, but whether you will suffer a permanent loss of capital.' When we think about how risky a company is, we always like to look at its use of debt, since debt overload can lead to ruin. We can see that Chart Industries, Inc. (NYSE:GTLS) does use debt in its business. But should shareholders be worried about its use of debt?
What Risk Does Debt Bring?
Generally speaking, debt only becomes a real problem when a company can't easily pay it off, either by raising capital or with its own cash flow. Ultimately, if the company can't fulfill its legal obligations to repay debt, shareholders could walk away with nothing. However, a more usual (but still expensive) situation is where a company must dilute shareholders at a cheap share price simply to get debt under control. Of course, debt can be an important tool in businesses, particularly capital heavy businesses. The first thing to do when considering how much debt a business uses is to look at its cash and debt together.
View our latest analysis for Chart Industries
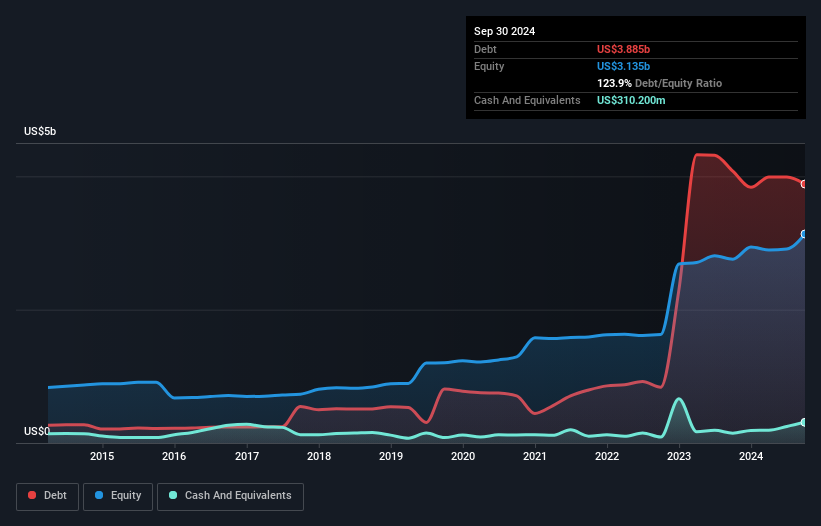
What Is Chart Industries's Debt?
You can click the graphic below for the historical numbers, but it shows that Chart Industries had US$3.88b of debt in September 2024, down from US$4.08b, one year before. On the flip side, it has US$310.2m in cash leading to net debt of about US$3.57b.
How Strong Is Chart Industries' Balance Sheet?
We can see from the most recent balance sheet that Chart Industries had liabilities of US$2.00b falling due within a year, and liabilities of US$4.36b due beyond that. On the other hand, it had cash of US$310.2m and US$1.51b worth of receivables due within a year. So its liabilities outweigh the sum of its cash and (near-term) receivables by US$4.54b.
Chart Industries has a market capitalization of US$7.98b, so it could very likely raise cash to ameliorate its balance sheet, if the need arose. However, it is still worthwhile taking a close look at its ability to pay off debt.
We use two main ratios to inform us about debt levels relative to earnings. The first is net debt divided by earnings before interest, tax, depreciation, and amortization (EBITDA), while the second is how many times its earnings before interest and tax (EBIT) covers its interest expense (or its interest cover, for short). Thus we consider debt relative to earnings both with and without depreciation and amortization expenses.
While Chart Industries's debt to EBITDA ratio (3.9) suggests that it uses some debt, its interest cover is very weak, at 2.0, suggesting high leverage. So shareholders should probably be aware that interest expenses appear to have really impacted the business lately. However, it should be some comfort for shareholders to recall that Chart Industries actually grew its EBIT by a hefty 102%, over the last 12 months. If that earnings trend continues it will make its debt load much more manageable in the future. The balance sheet is clearly the area to focus on when you are analysing debt. But it is future earnings, more than anything, that will determine Chart Industries's ability to maintain a healthy balance sheet going forward. So if you want to see what the professionals think, you might find this free report on analyst profit forecasts to be interesting.
Finally, while the tax-man may adore accounting profits, lenders only accept cold hard cash. So we always check how much of that EBIT is translated into free cash flow. Over the last three years, Chart Industries reported free cash flow worth 15% of its EBIT, which is really quite low. That limp level of cash conversion undermines its ability to manage and pay down debt.
Our View
Chart Industries's interest cover and net debt to EBITDA definitely weigh on it, in our esteem. But its EBIT growth rate tells a very different story, and suggests some resilience. Taking the abovementioned factors together we do think Chart Industries's debt poses some risks to the business. While that debt can boost returns, we think the company has enough leverage now. The balance sheet is clearly the area to focus on when you are analysing debt. But ultimately, every company can contain risks that exist outside of the balance sheet. Case in point: We've spotted 1 warning sign for Chart Industries you should be aware of.
When all is said and done, sometimes its easier to focus on companies that don't even need debt. Readers can access a list of growth stocks with zero net debt 100% free, right now.
New: AI Stock Screener & Alerts
Our new AI Stock Screener scans the market every day to uncover opportunities.
• Dividend Powerhouses (3%+ Yield)• Undervalued Small Caps with Insider Buying• High growth Tech and AI CompaniesOr build your own from over 50 metrics.
Explore Now for FreeHave feedback on this article? Concerned about the content? Get in touch with us directly. Alternatively, email editorial-team (at) simplywallst.com.This article by Simply Wall St is general in nature. We provide commentary based on historical data and analyst forecasts only using an unbiased methodology and our articles are not intended to be financial advice. It does not constitute a recommendation to buy or sell any stock, and does not take account of your objectives, or your financial situation. We aim to bring you long-term focused analysis driven by fundamental data. Note that our analysis may not factor in the latest price-sensitive company announcements or qualitative material. Simply Wall St has no position in any stocks mentioned.
免責聲明:投資有風險,本文並非投資建議,以上內容不應被視為任何金融產品的購買或出售要約、建議或邀請,作者或其他用戶的任何相關討論、評論或帖子也不應被視為此類內容。本文僅供一般參考,不考慮您的個人投資目標、財務狀況或需求。TTM對信息的準確性和完整性不承擔任何責任或保證,投資者應自行研究並在投資前尋求專業建議。
熱議股票
- 1
- 2
- 3
- 4
- 5
- 6
- 7
- 8
- 9
- 10