Fangzhou Inc. (HKG:6086) insiders, who hold 40% of the firm would be disappointed by the recent pullback
Key Insights
- Fangzhou's significant insider ownership suggests inherent interests in company's expansion
- 67% of the business is held by the top 3 shareholders
- Ownership research, combined with past performance data can help provide a good understanding of opportunities in a stock
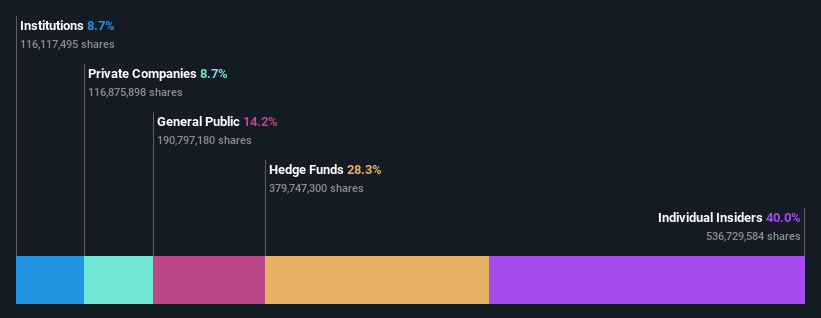
To get a sense of who is truly in control of Fangzhou Inc. (HKG:6086), it is important to understand the ownership structure of the business. The group holding the most number of shares in the company, around 40% to be precise, is individual insiders. Put another way, the group faces the maximum upside potential (or downside risk).
And following last week's 36% decline in share price, insiders suffered the most losses.
Let's take a closer look to see what the different types of shareholders can tell us about Fangzhou.
View our latest analysis for Fangzhou
What Does The Institutional Ownership Tell Us About Fangzhou?
Institutional investors commonly compare their own returns to the returns of a commonly followed index. So they generally do consider buying larger companies that are included in the relevant benchmark index.
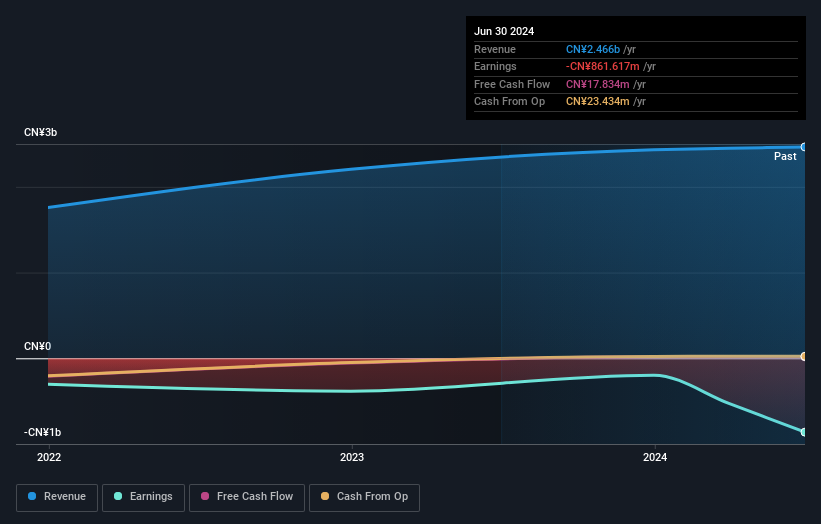
As you can see, institutional investors have a fair amount of stake in Fangzhou. This implies the analysts working for those institutions have looked at the stock and they like it. But just like anyone else, they could be wrong. It is not uncommon to see a big share price drop if two large institutional investors try to sell out of a stock at the same time. So it is worth checking the past earnings trajectory of Fangzhou, (below). Of course, keep in mind that there are other factors to consider, too.
It looks like hedge funds own 28% of Fangzhou shares. That worth noting, since hedge funds are often quite active investors, who may try to influence management. Many want to see value creation (and a higher share price) in the short term or medium term. Our data shows that Ares Management LLC is the largest shareholder with 28% of shares outstanding. Meanwhile, the second and third largest shareholders, hold 21% and 18%, of the shares outstanding, respectively. Note that the second and third-largest shareholders are also Chief Executive Officer and Member of the Board of Directors, respectively, meaning that the company's top shareholders are insiders.
A more detailed study of the shareholder registry showed us that 3 of the top shareholders have a considerable amount of ownership in the company, via their 67% stake.
While studying institutional ownership for a company can add value to your research, it is also a good practice to research analyst recommendations to get a deeper understand of a stock's expected performance. As far as we can tell there isn't analyst coverage of the company, so it is probably flying under the radar.
Insider Ownership Of Fangzhou
The definition of company insiders can be subjective and does vary between jurisdictions. Our data reflects individual insiders, capturing board members at the very least. Company management run the business, but the CEO will answer to the board, even if he or she is a member of it.
Insider ownership is positive when it signals leadership are thinking like the true owners of the company. However, high insider ownership can also give immense power to a small group within the company. This can be negative in some circumstances.
Our most recent data indicates that insiders own a reasonable proportion of Fangzhou Inc.. Insiders have a HK$2.3b stake in this HK$5.7b business. This may suggest that the founders still own a lot of shares. You can click here to see if they have been buying or selling.
General Public Ownership
With a 14% ownership, the general public, mostly comprising of individual investors, have some degree of sway over Fangzhou. While this group can't necessarily call the shots, it can certainly have a real influence on how the company is run.
Private Company Ownership
We can see that Private Companies own 8.7%, of the shares on issue. Private companies may be related parties. Sometimes insiders have an interest in a public company through a holding in a private company, rather than in their own capacity as an individual. While it's hard to draw any broad stroke conclusions, it is worth noting as an area for further research.
Next Steps:
It's always worth thinking about the different groups who own shares in a company. But to understand Fangzhou better, we need to consider many other factors. For instance, we've identified 2 warning signs for Fangzhou (1 doesn't sit too well with us) that you should be aware of.
If you would prefer check out another company -- one with potentially superior financials -- then do not miss this free list of interesting companies, backed by strong financial data.
NB: Figures in this article are calculated using data from the last twelve months, which refer to the 12-month period ending on the last date of the month the financial statement is dated. This may not be consistent with full year annual report figures.
New: AI Stock Screener & Alerts
Our new AI Stock Screener scans the market every day to uncover opportunities.
• Dividend Powerhouses (3%+ Yield)• Undervalued Small Caps with Insider Buying• High growth Tech and AI CompaniesOr build your own from over 50 metrics.
Explore Now for FreeHave feedback on this article? Concerned about the content? Get in touch with us directly. Alternatively, email editorial-team (at) simplywallst.com.This article by Simply Wall St is general in nature. We provide commentary based on historical data and analyst forecasts only using an unbiased methodology and our articles are not intended to be financial advice. It does not constitute a recommendation to buy or sell any stock, and does not take account of your objectives, or your financial situation. We aim to bring you long-term focused analysis driven by fundamental data. Note that our analysis may not factor in the latest price-sensitive company announcements or qualitative material. Simply Wall St has no position in any stocks mentioned.
免責聲明:投資有風險,本文並非投資建議,以上內容不應被視為任何金融產品的購買或出售要約、建議或邀請,作者或其他用戶的任何相關討論、評論或帖子也不應被視為此類內容。本文僅供一般參考,不考慮您的個人投資目標、財務狀況或需求。TTM對信息的準確性和完整性不承擔任何責任或保證,投資者應自行研究並在投資前尋求專業建議。
熱議股票
- 1
- 2
- 3
- 4
- 5
- 6
- 7
- 8
- 9
- 10