XDC Defies Market Trend, Surges 7% Amid Short Pressure
- XDC token surges 7%, defying market trends; technical indicators signal continued upward momentum.
- Rising On-Balance Volume underscores strong buying interest, signaling a potential extension of XDC's uptrend.
- Negative funding rate reveals short pressure, creating a potential short squeeze that could push XDC’s price to $0.10.
The XDC Network token has defied the broader market trend, climbing 7% in the past 24 hours to become the top gainer among major cryptocurrencies.
With strong bullish momentum, XDC looks set to extend its rally in the short term. This analysis examines recent market trends and highlights potential price targets for the altcoin.
XDC Sees Surge in Demand on the Daily Chart
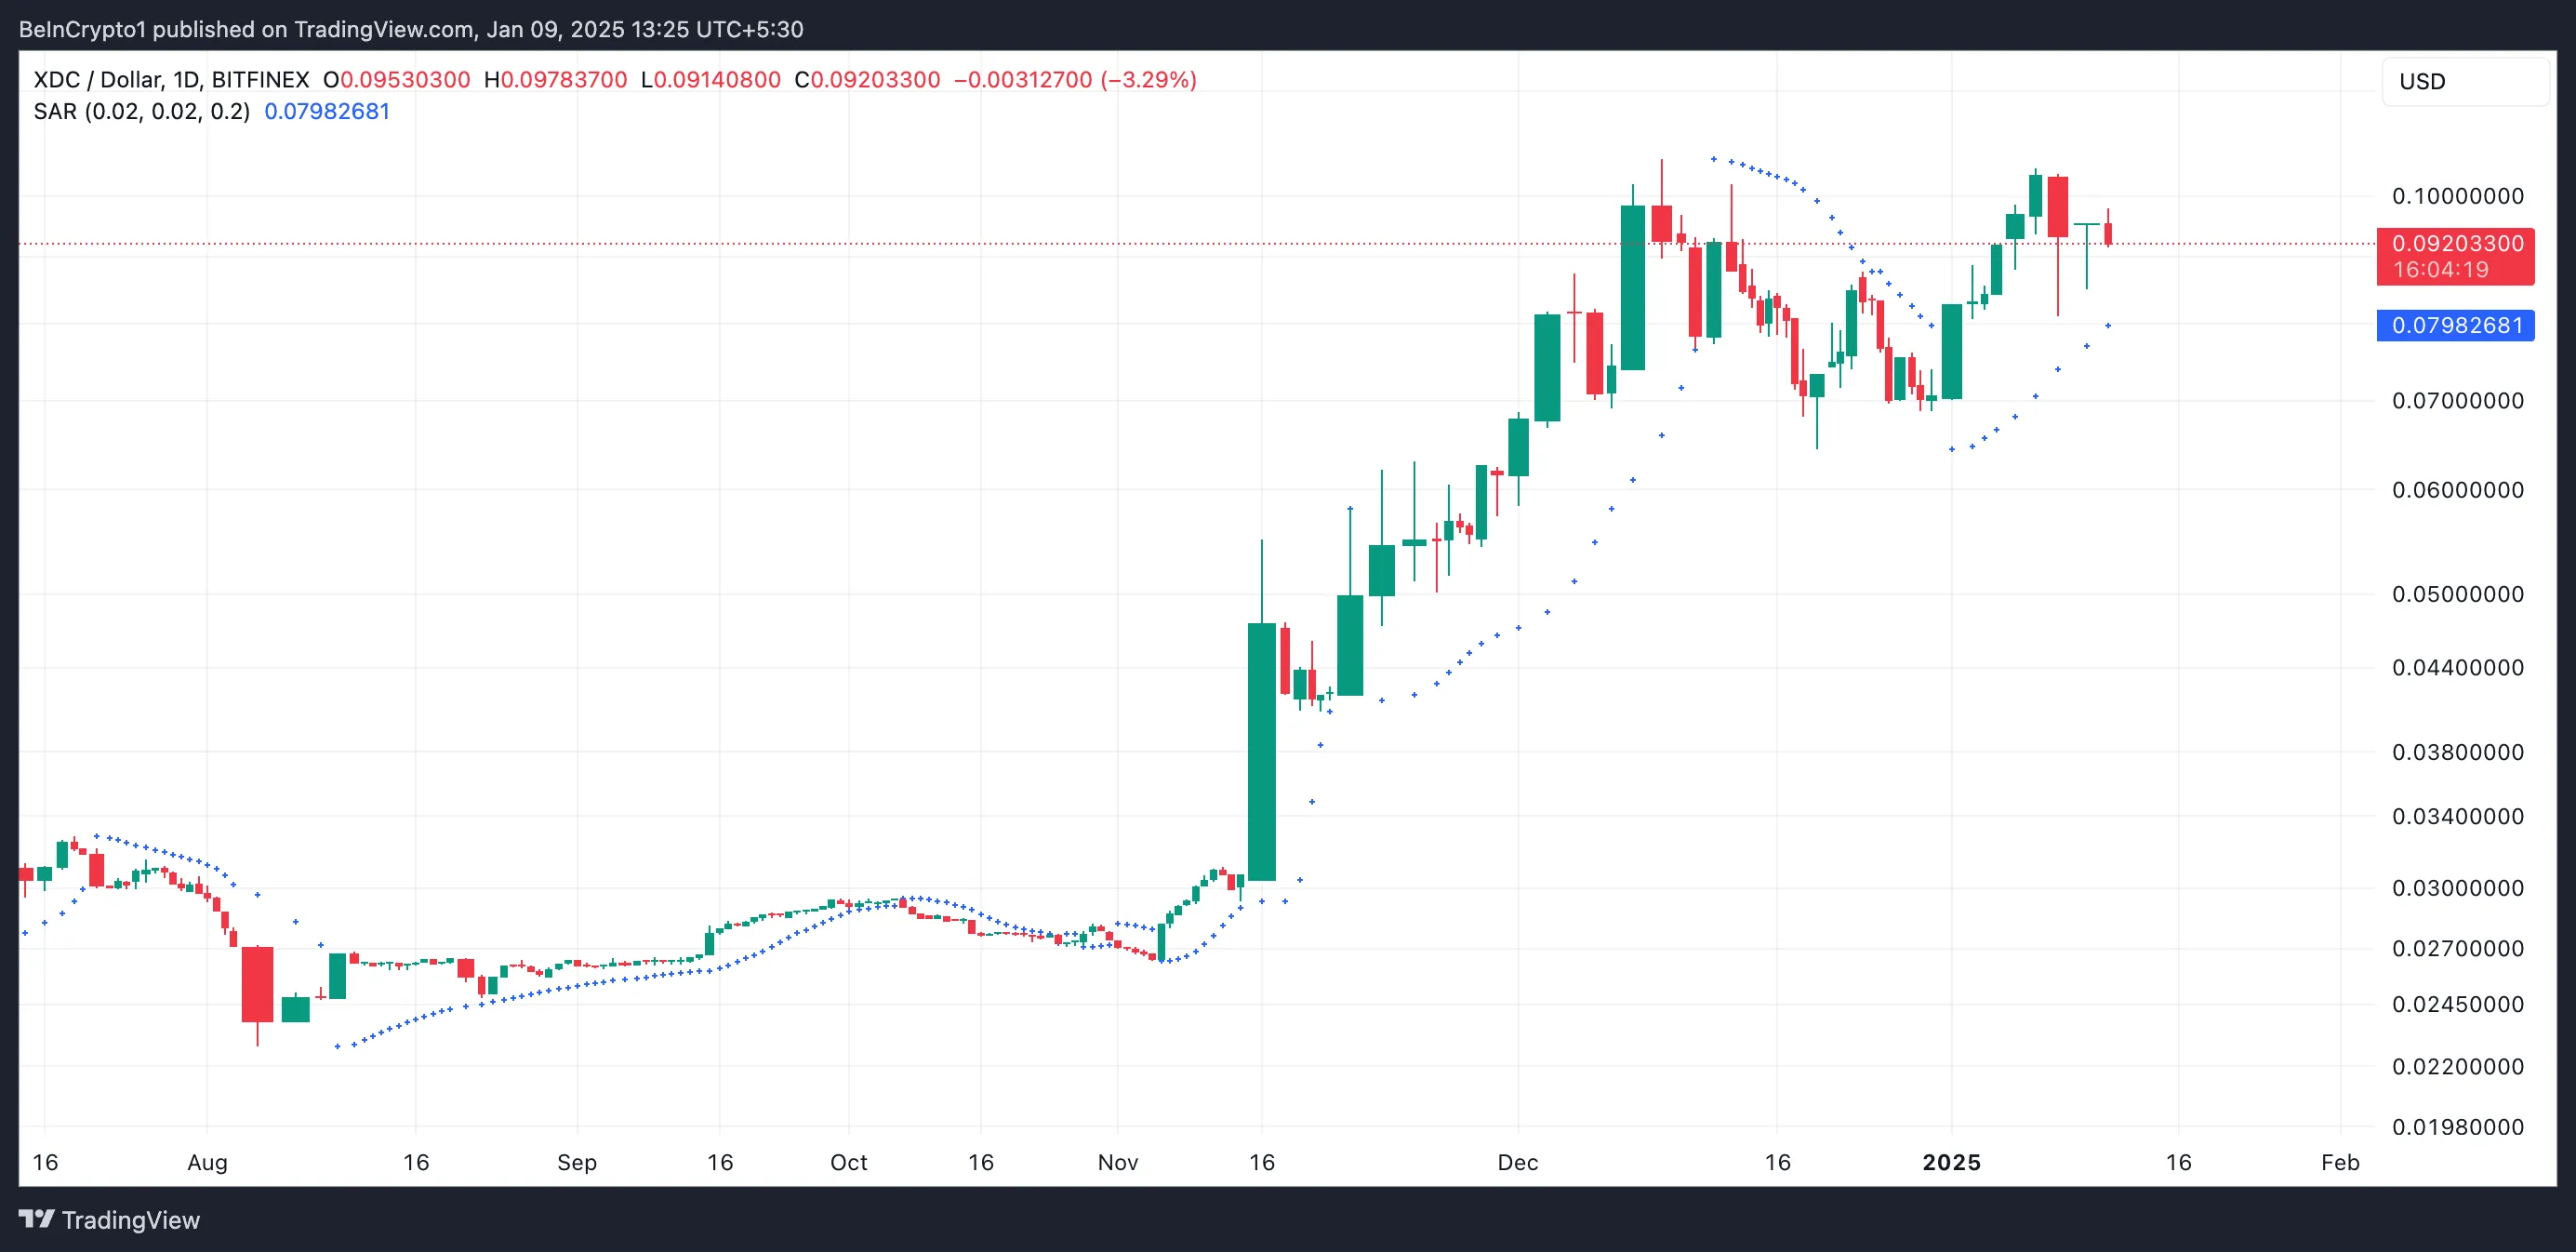
XDC currently trades above the dotted lines of its Parabolic Stop and Reverse (SAR) indicator. This indicator tracks an asset’s price trends and identifies potential reversals by plotting dots above or below an asset’s price.
When the asset’s price trades above the SAR dots, it suggests it is in an uptrend, signaling bullish momentum. Conversely, if the price drops below the SAR dots, it indicates a downtrend or bearish reversal may be underway.
Therefore, the setup of XDC’s Parabolic SAR indicator reflects the bullish sentiment toward it among market participants, hinting at more gains in the short term.
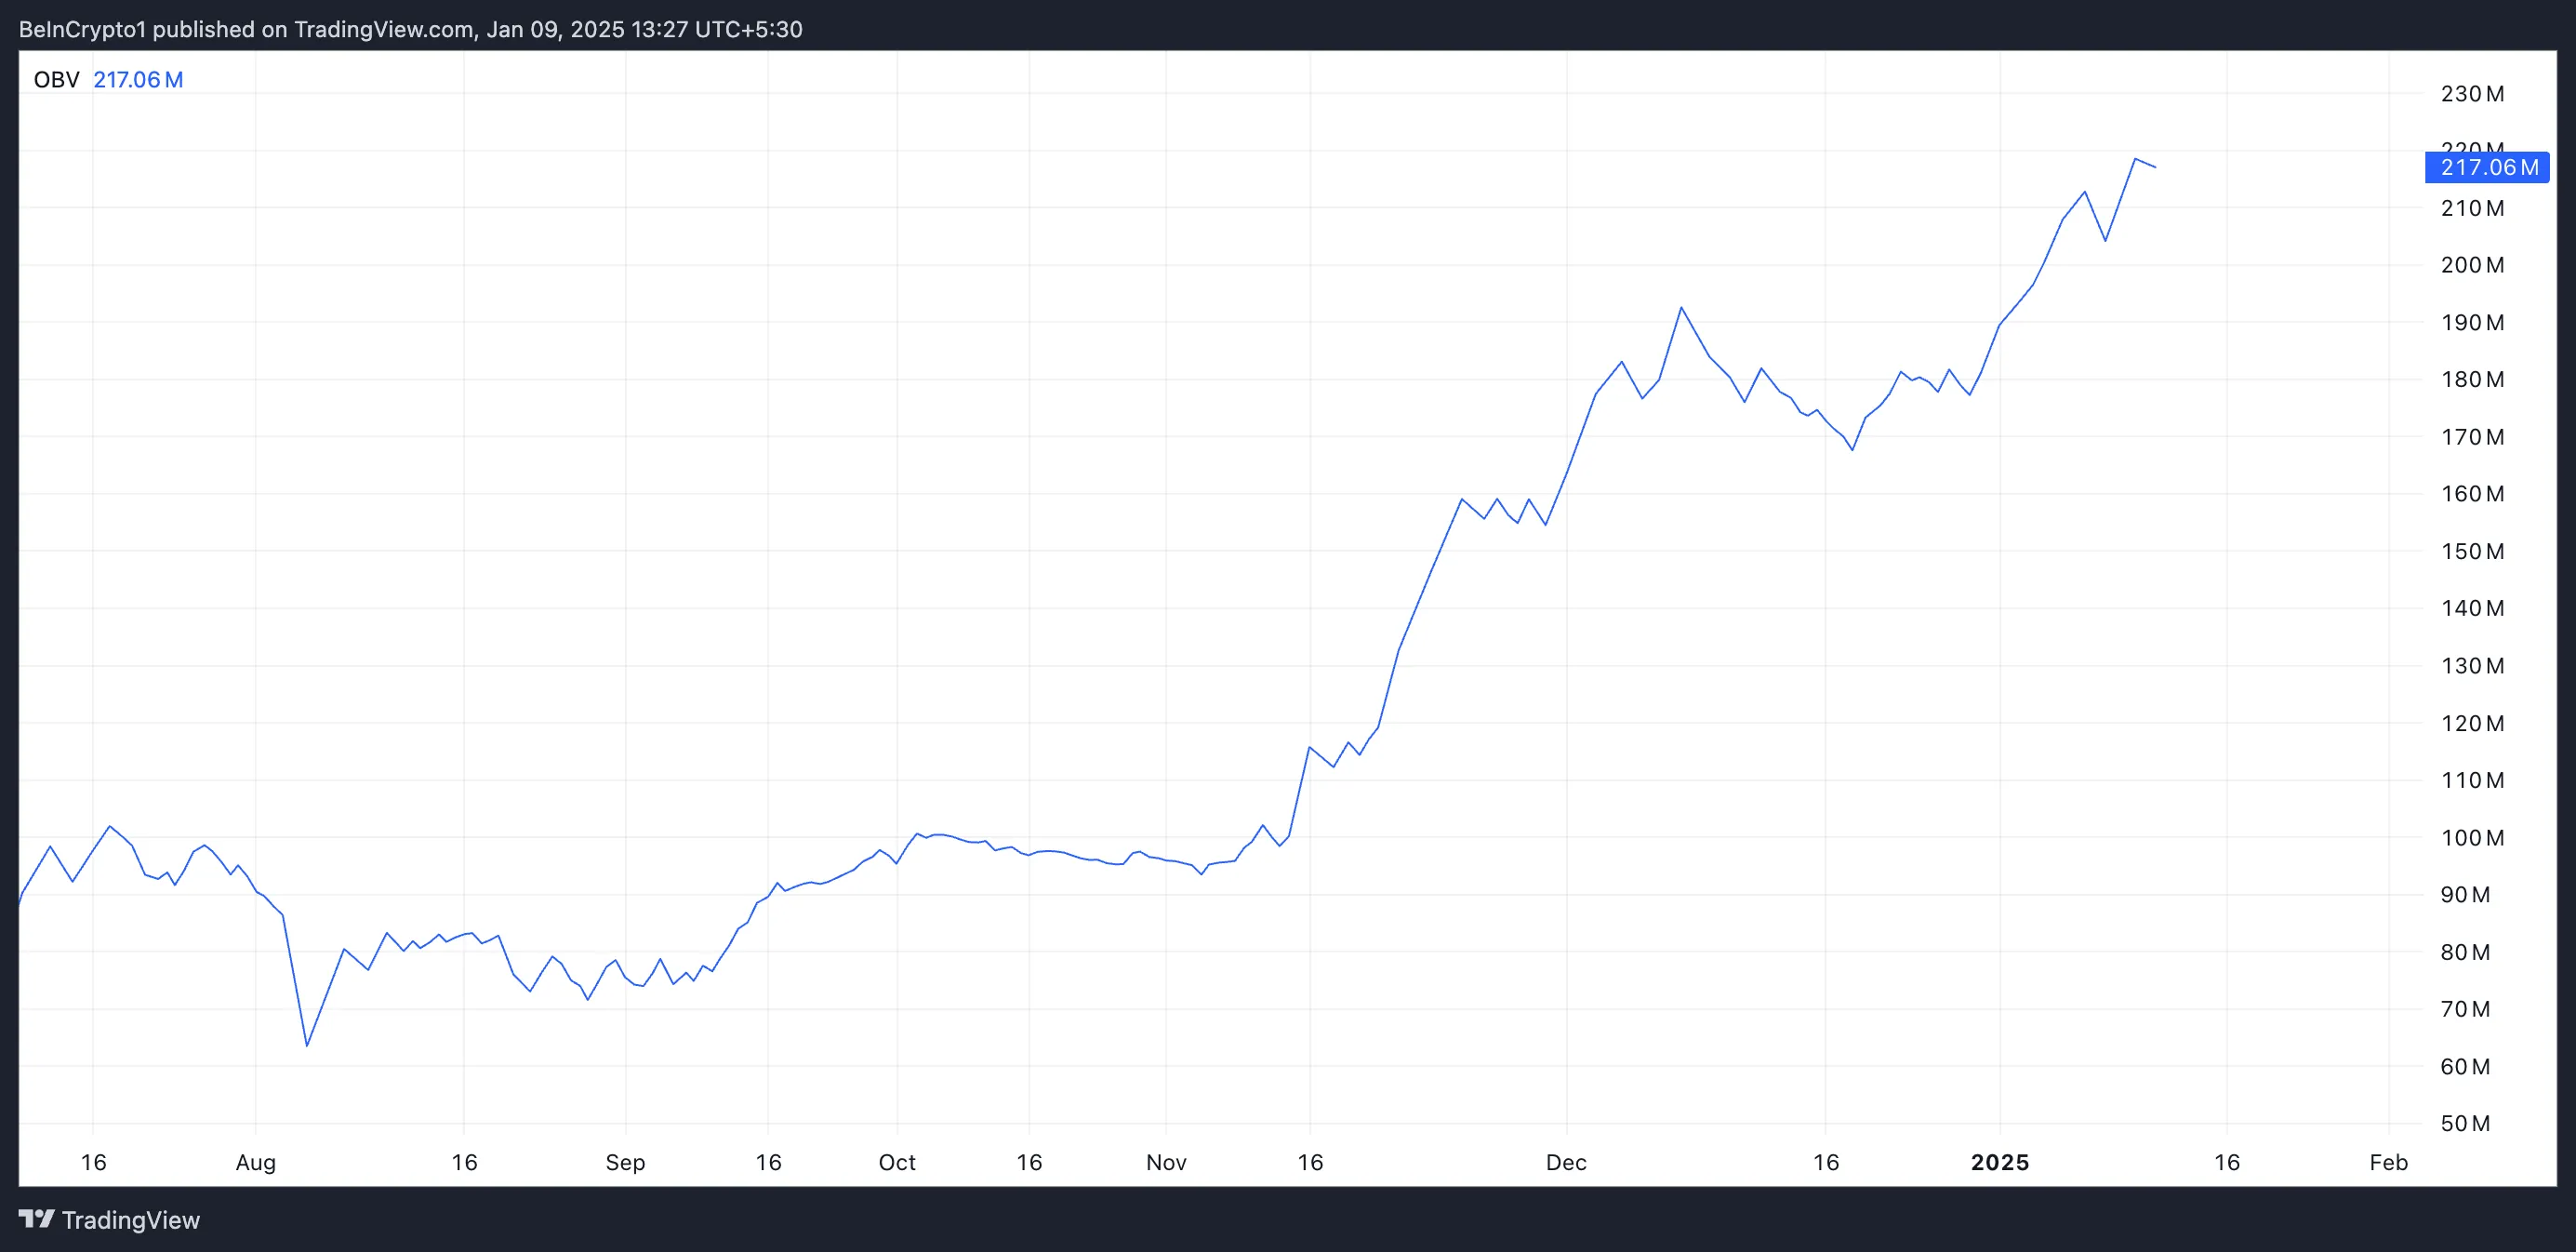
Moreover, XDC’s rising On-Balance-Volume (OBV) confirms the growing demand for the altcoin. At press time, this momentum indicator, which measures an asset’s buying and selling pressure, is in an upward trend at 217.06 million.
When an asset’s OBV climbs like this, it suggests strong buying interest, often signaling a continuation of an uptrend.
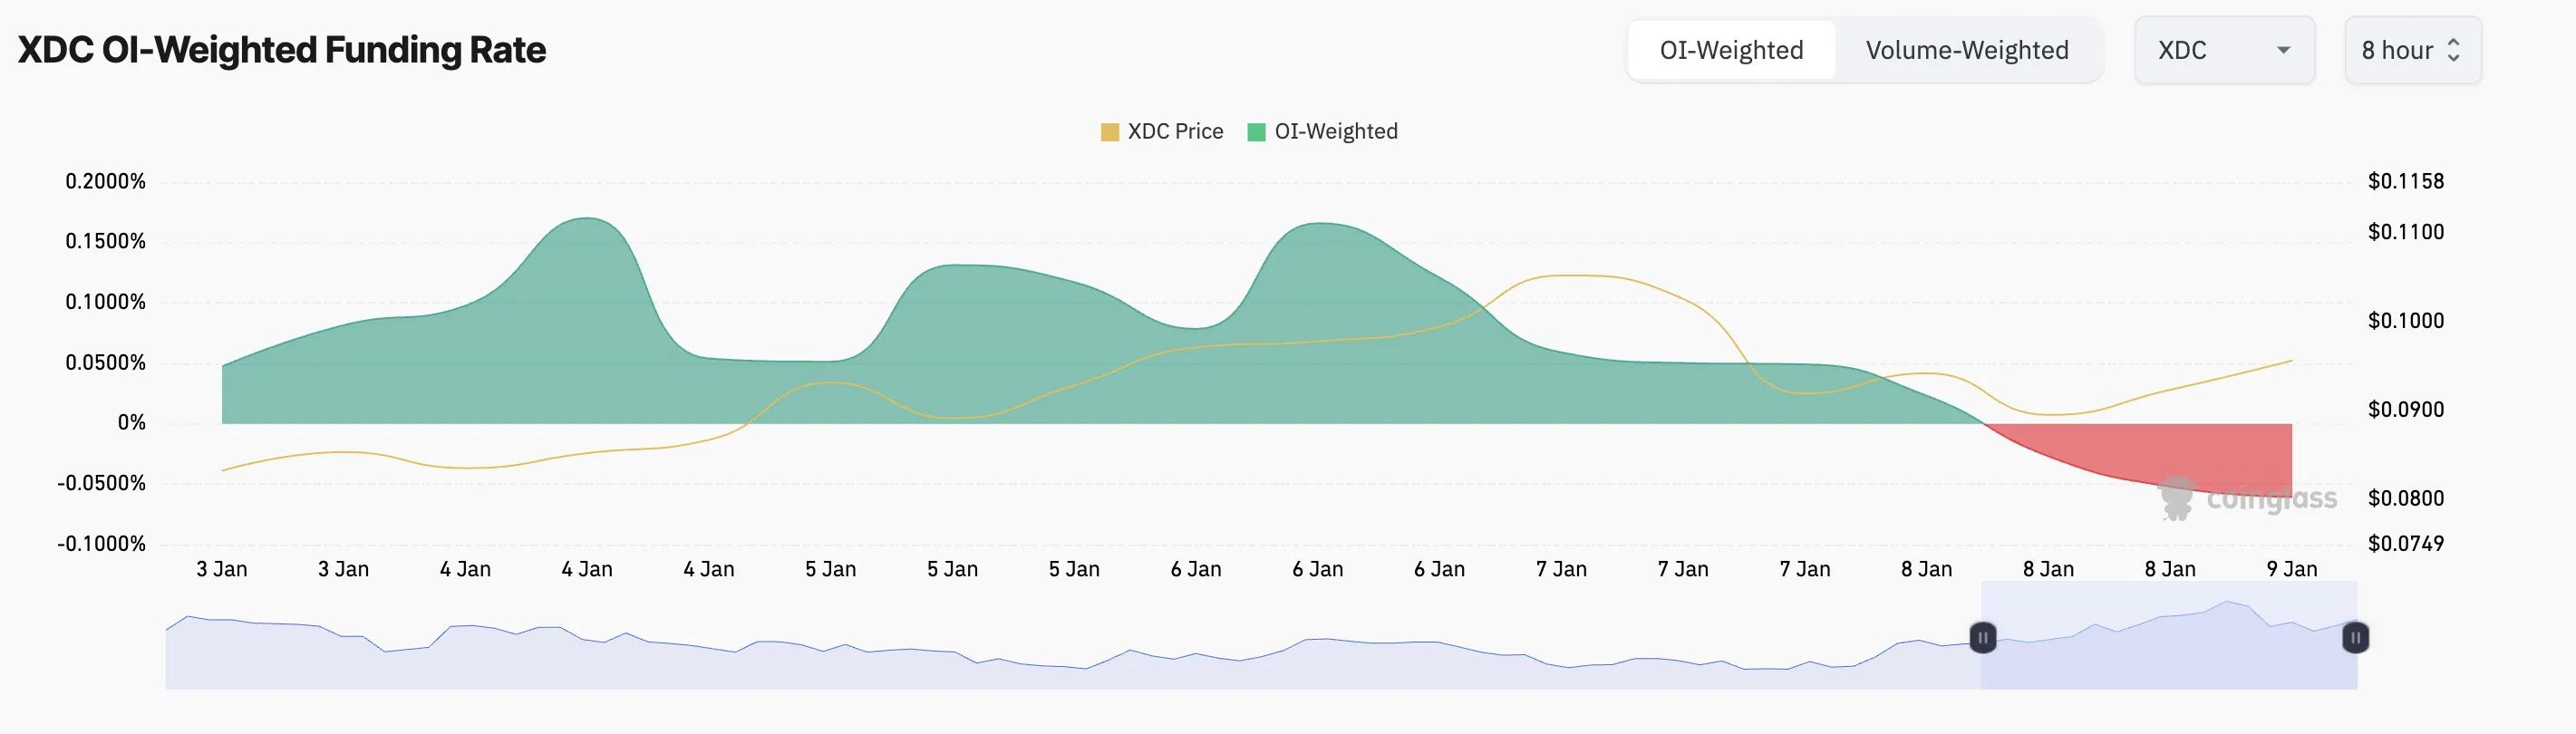
However, many XDC futures traders are challenging the uptrend, as evidenced by the token’s negative funding rate. Currently at -0.06, this reflects a strong demand for short positions.
The funding rate is a periodic fee exchanged between traders in perpetual futures markets to balance long and short positions, based on the difference between the contract price and the spot price. A negative funding rate means short positions are paying longs, indicating bearish sentiment and that traders expect the asset’s price to decline.
XDC Price Prediction: Short Squeeze Looms as Bullish Momentum Builds
If bullish momentum continues, XDC’s short sellers could face a squeeze. In that scenario, its price could touch $0.10, triggering the liquidation of some short positions.
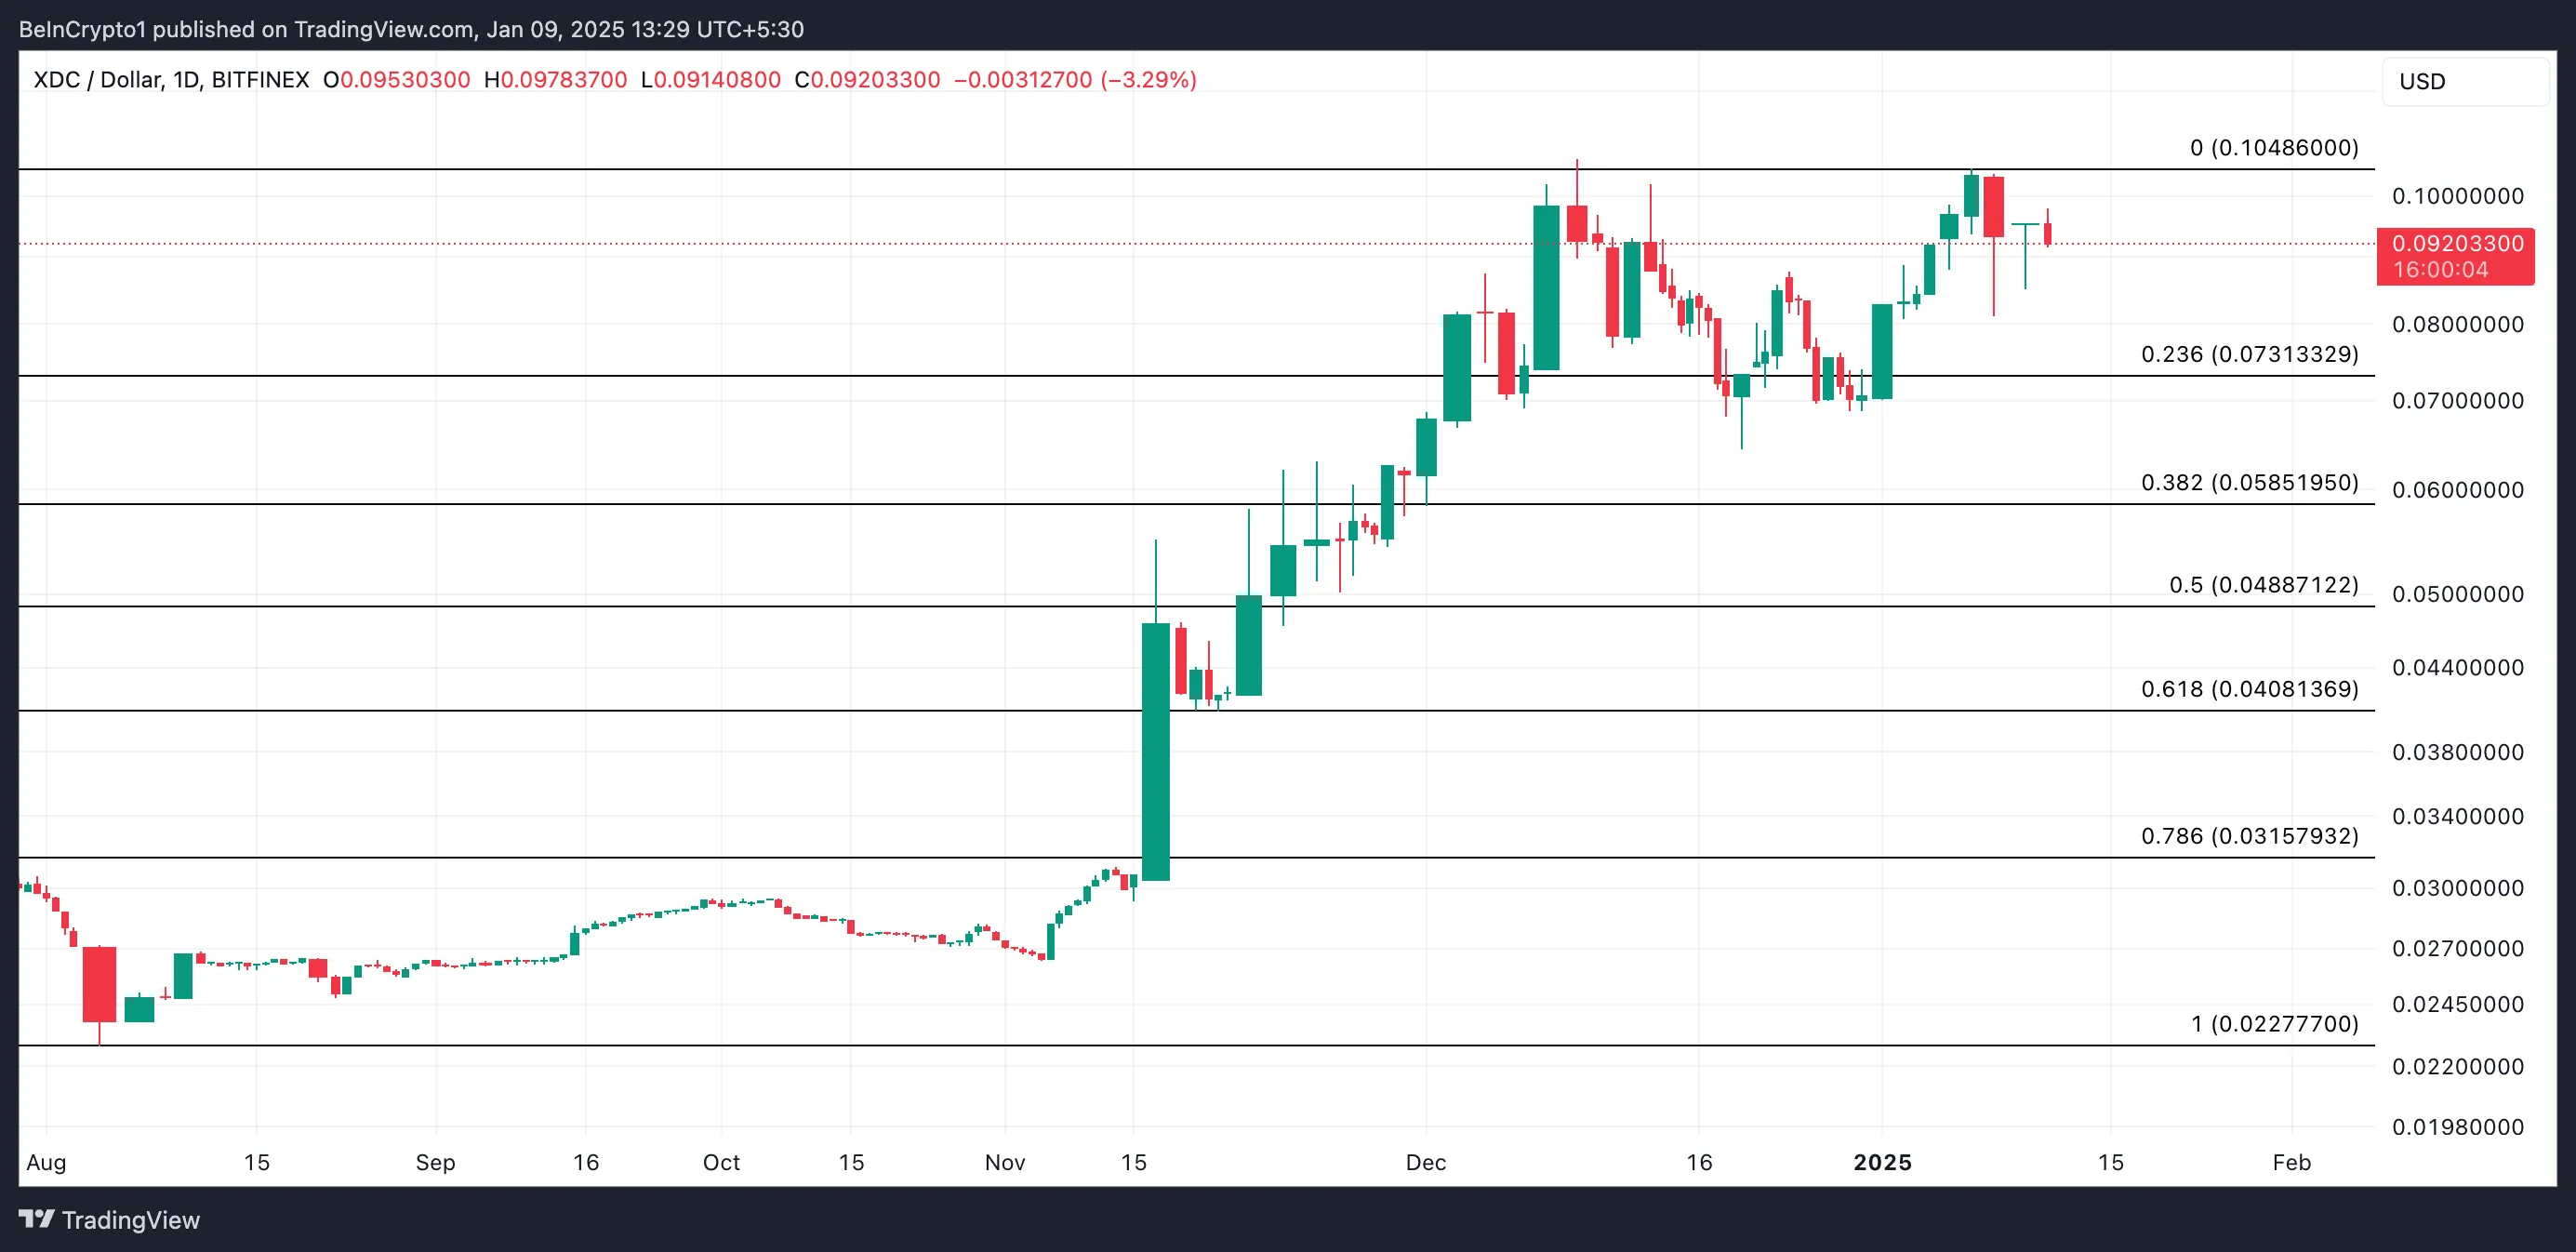
However, if buying pressure weakens, XDC’s price could retreat to $0.07, offering profits to short traders.
免責聲明:投資有風險,本文並非投資建議,以上內容不應被視為任何金融產品的購買或出售要約、建議或邀請,作者或其他用戶的任何相關討論、評論或帖子也不應被視為此類內容。本文僅供一般參考,不考慮您的個人投資目標、財務狀況或需求。TTM對信息的準確性和完整性不承擔任何責任或保證,投資者應自行研究並在投資前尋求專業建議。
熱議股票
- 1
- 2
- 3
- 4
- 5
- 6
- 7
- 8
- 9
- 10