Ethereum (ETH) Price Drops 8% With Metrics Indicating Further Declines
- Ethereum price drops nearly 8%, with its market cap nearing $400B as RSI hits 27.1, signaling oversold conditions and weak sentiment.
- ADX confirms a strong downtrend as selling pressure (-DI) dominates, while bullish momentum (+DI) sharply weakens.
- Death cross risk looms; ETH could decline to $2,723 if support levels break but may rebound if resistance at $3,448 is overcome.
Ethereum (ETH) price has dropped nearly 8% in the last 24 hours, nearing the loss of its $400 billion market cap. The sell-off has pushed ETH’s RSI to 27.1, its lowest since December 20, signaling oversold conditions and weak market sentiment.
The ADX indicates that the current downtrend is strong, with bearish momentum dominating as the -DI surpasses the +DI. If the downtrend continues, ETH could test critical support levels, but a reversal might allow it to challenge resistance and regain upward momentum.
Ethereum RSI Reached Its Lowest Level Since December 20
The Relative Strength Index (RSI) for Ethereum has plunged to 27.1, a sharp drop from 66.3 within just one day. RSI is a technical momentum indicator that measures the speed and magnitude of price movements on a scale from 0 to 100.
Typically, values above 70 indicate overbought conditions, suggesting a potential pullback, while values below 30 point to oversold conditions, often signaling a possible recovery. ETH’s current RSI level of 27.1 marks its lowest reading since December 20, reflecting significant bearish momentum and heavy selling pressure in the market.
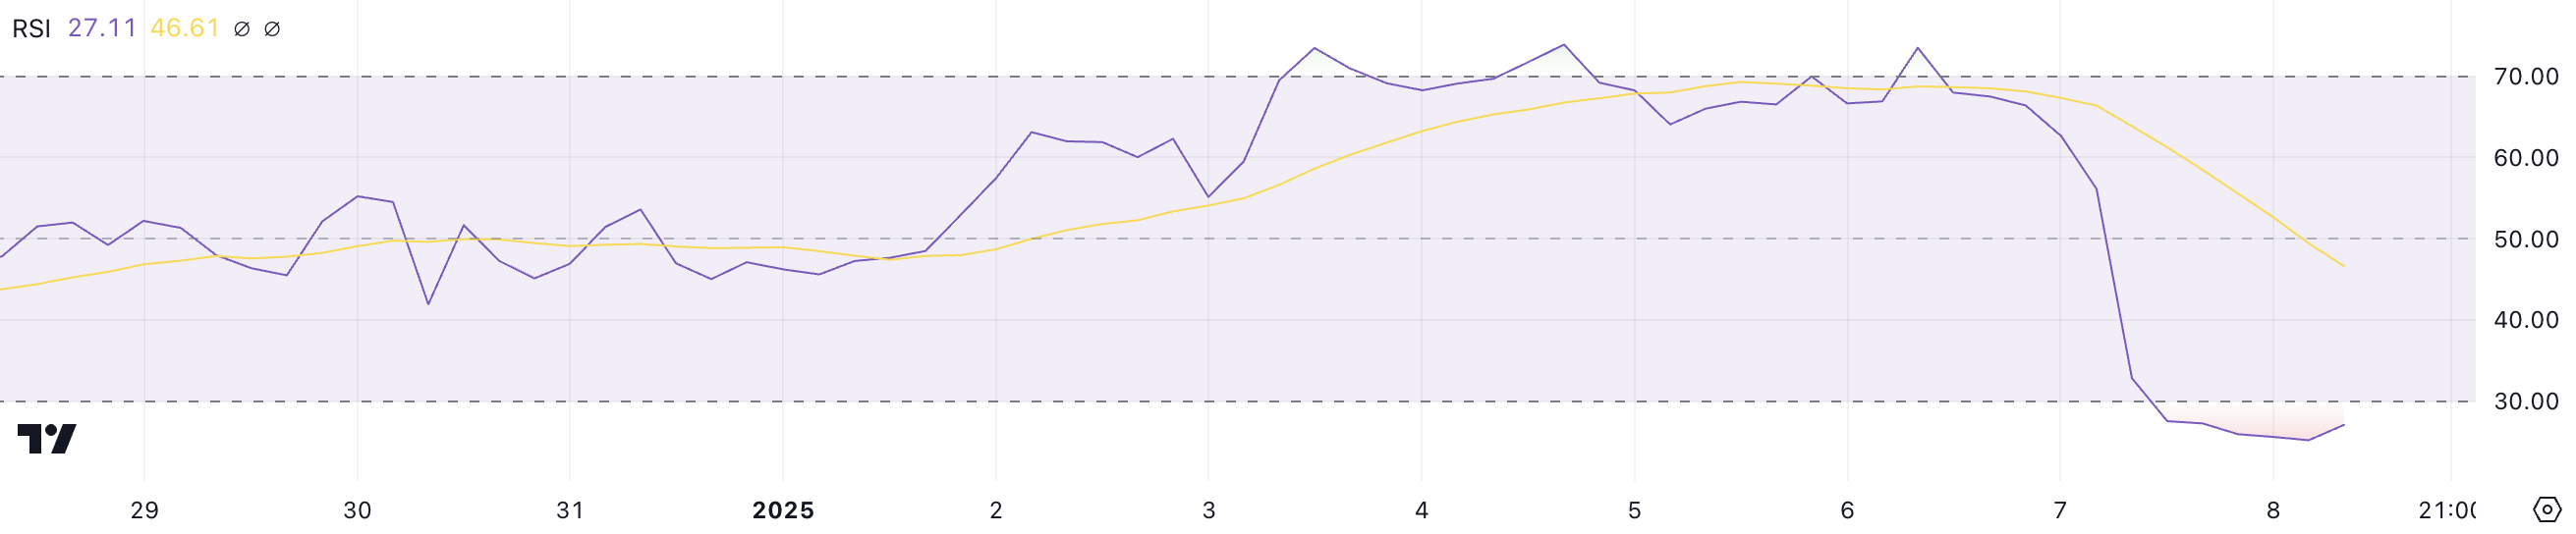
At this deeply oversold level, ETH RSI suggests that the recent sell-off may be overextended, creating potential conditions for a rebound if buying interest resurfaces.
However, the dramatic decline also highlights weak market sentiment, which could lead to continued downward pressure if the current trend persists.
ETH DMI Shows the Downtrend Is Strong
Ethereum Average Directional Index (ADX) is currently at 41.9, reflecting a strong market trend. ADX is a technical indicator that measures the strength of a trend, irrespective of its direction, on a scale from 0 to 100. Values above 25 indicate a strong trend, while values below 20 suggest weak or absent momentum.
The steady growth in ETH’s ADX since December 3 signals that the current market trend, though bearish, has been gaining strength and remains firmly in place.
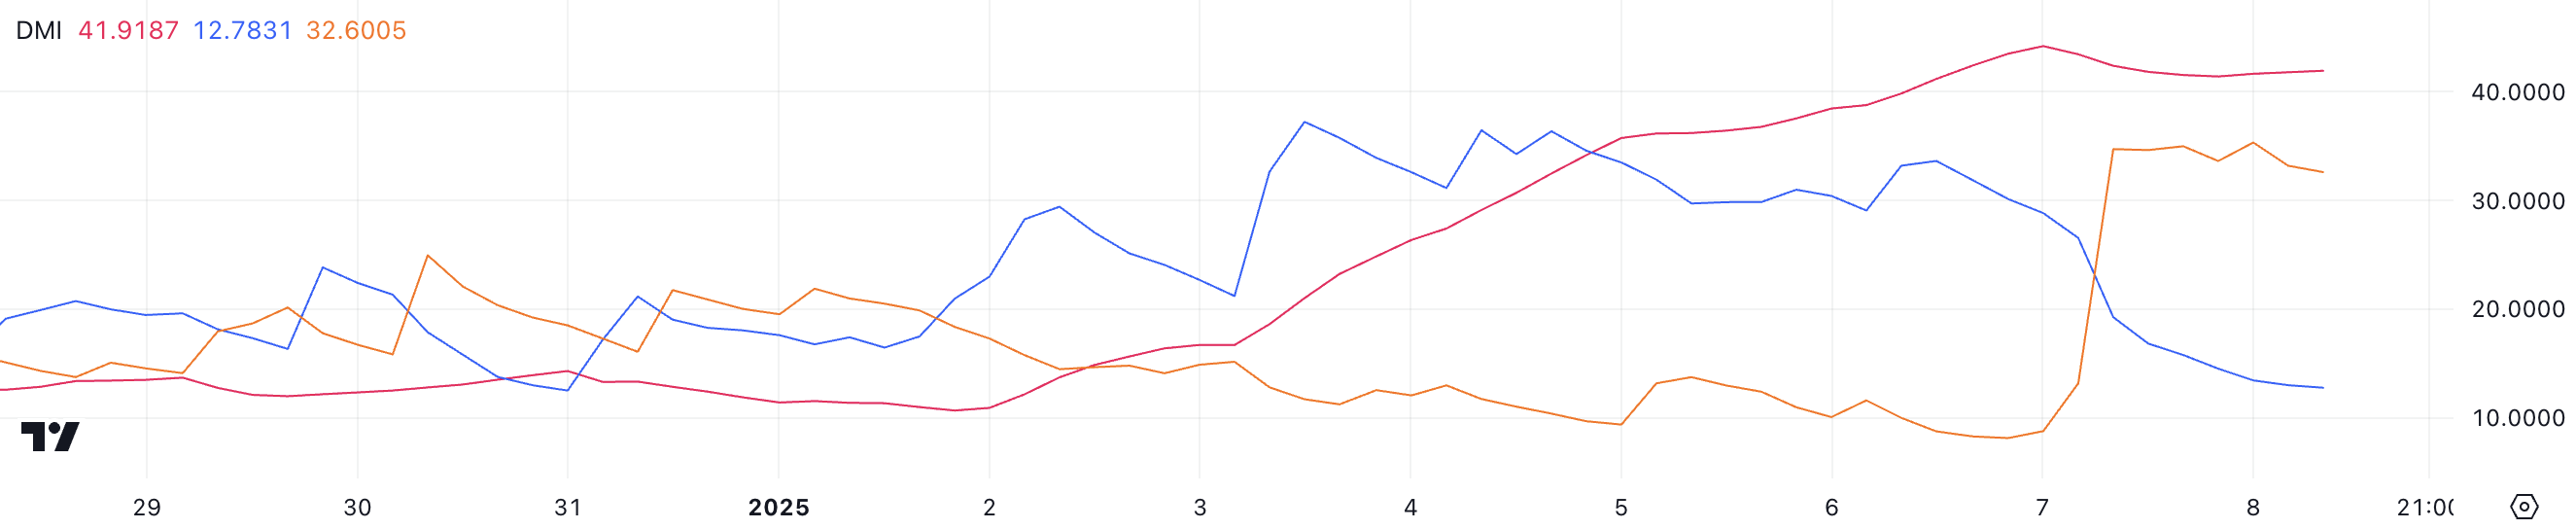
The +DI, representing buying pressure, has dropped sharply to 12.7 from 33.6 a day ago, indicating a significant weakening of bullish momentum. Conversely, the -DI, reflecting selling pressure, has surged to 32.5 from 8.7, highlighting growing bearish dominance.
This configuration confirms that ETH price is firmly in a downtrend, with sellers maintaining control. If this trend persists, ETH’s price could face continued declines unless buying pressure resurges to counteract the increasing bearish momentum.
ETH Price Prediction: Death Cross Looms While $3,448 Resistance Holds Key
Ethereum EMA lines indicate the potential for a death cross, a bearish signal where short-term EMAs cross below long-term EMAs. If this formation occurs, it could intensify the ongoing correction.
A break below the critical support levels of $3,297 and $3,096 could push ETH price further down to $2,723, marking a potential 18.8% decline.
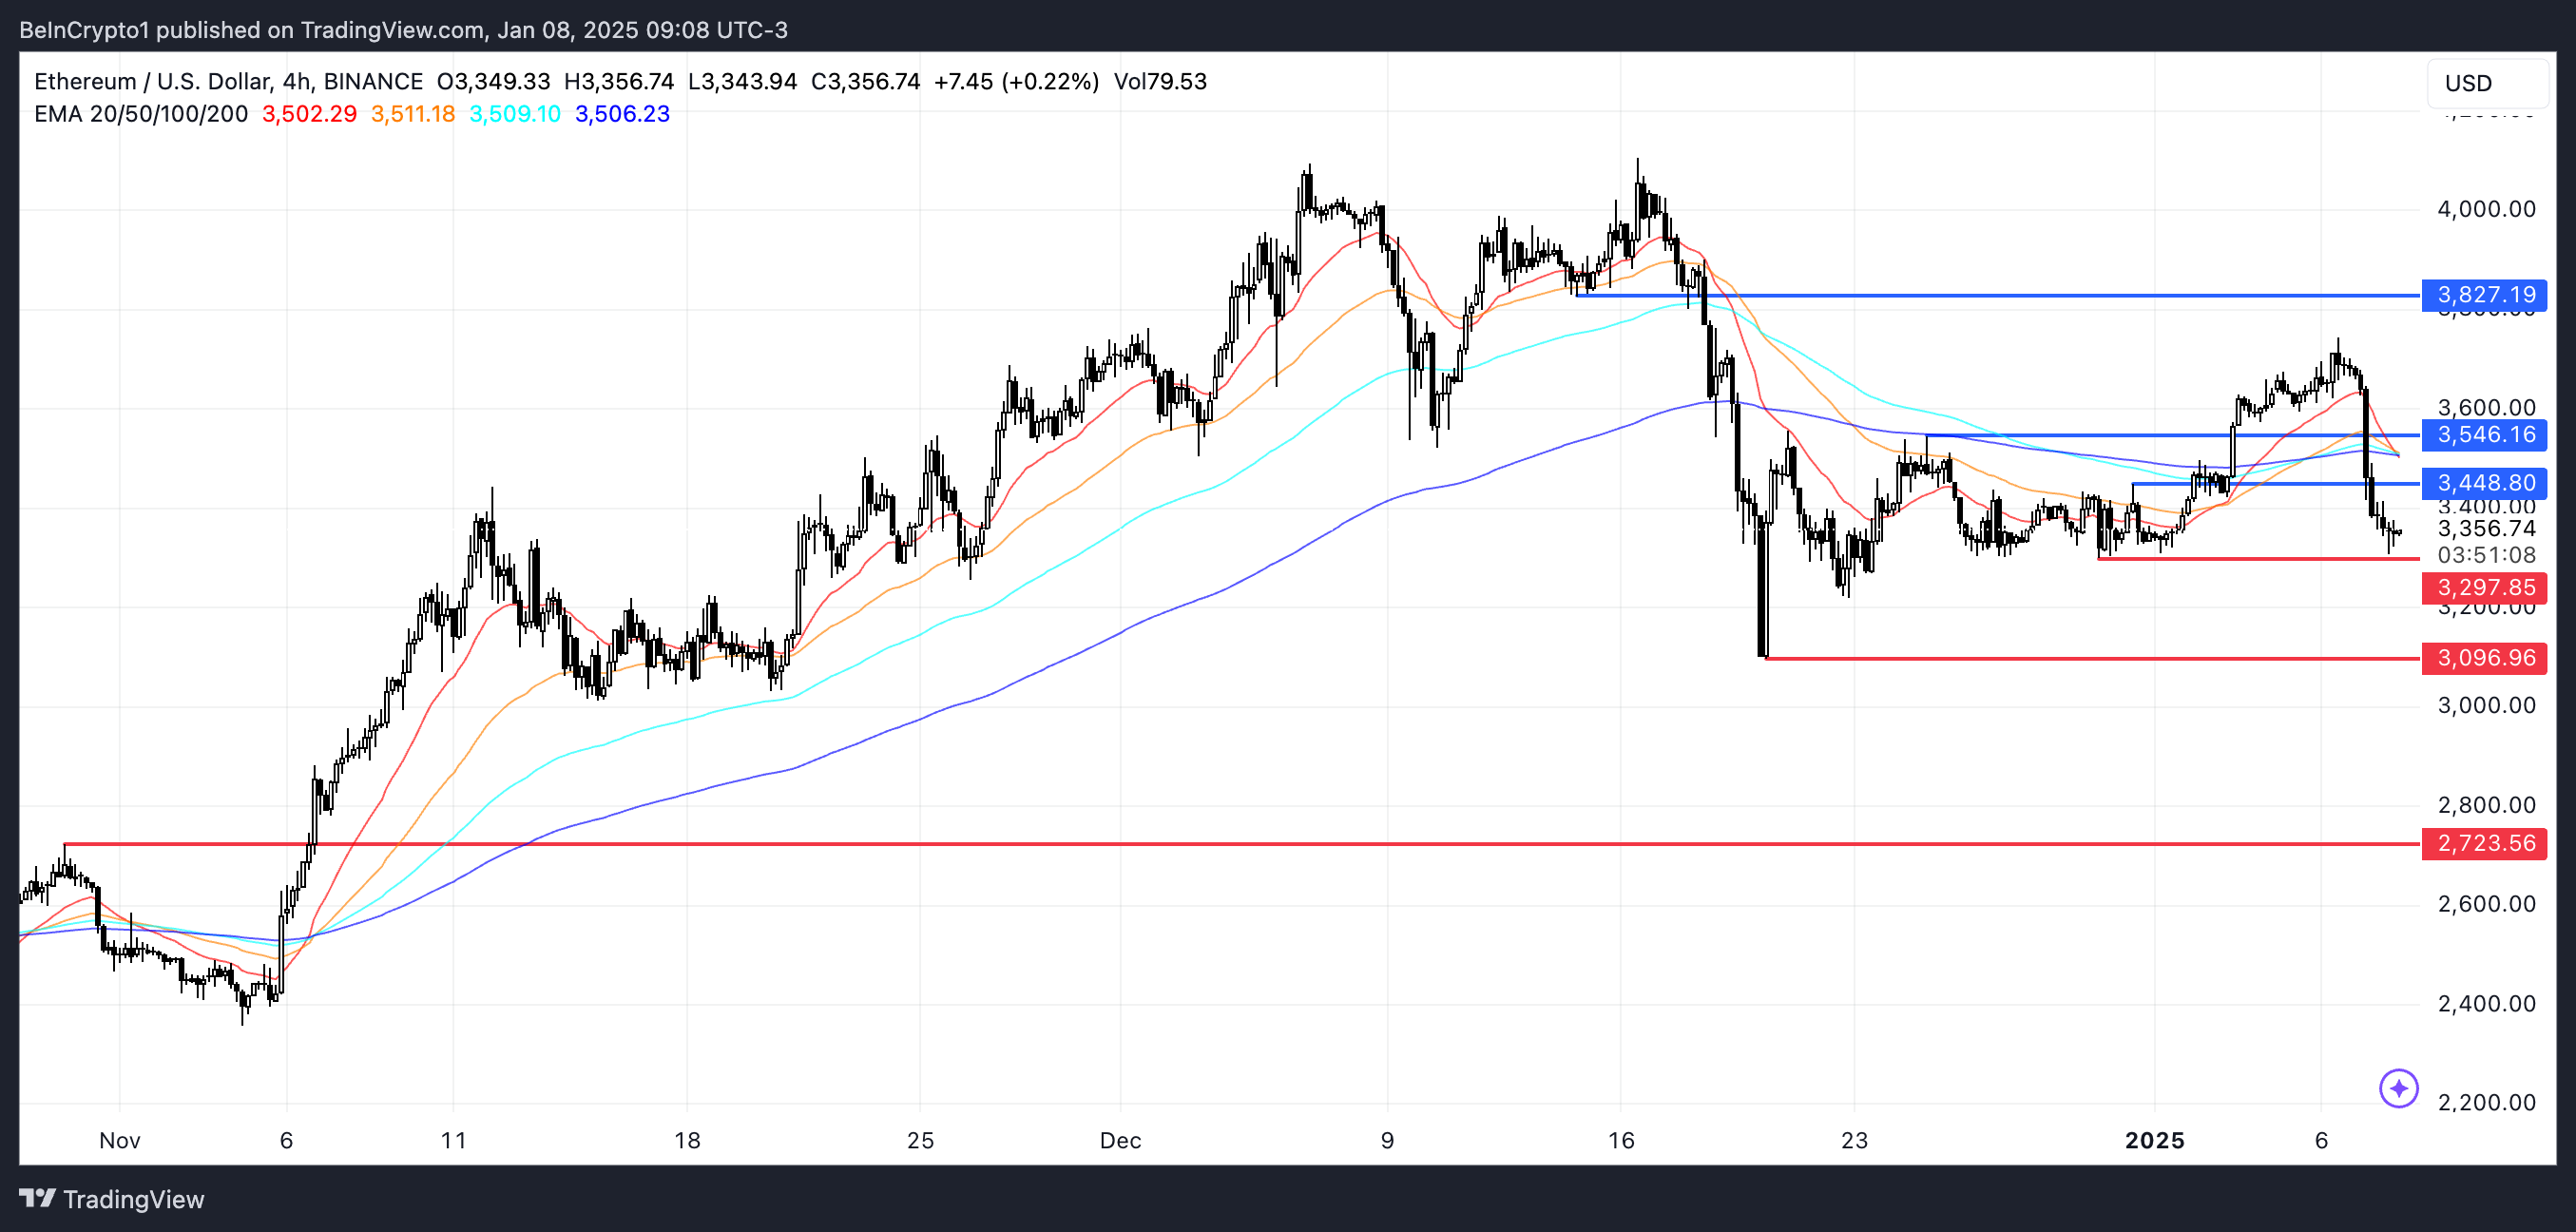
On the bullish side, Ethereum price could regain momentum if it holds above the key supports and reverses the current trend. In such a case, ETH might test the resistance at $3,448, and a successful breakout could lead to $3,546 and even $3,827.
免責聲明:投資有風險,本文並非投資建議,以上內容不應被視為任何金融產品的購買或出售要約、建議或邀請,作者或其他用戶的任何相關討論、評論或帖子也不應被視為此類內容。本文僅供一般參考,不考慮您的個人投資目標、財務狀況或需求。TTM對信息的準確性和完整性不承擔任何責任或保證,投資者應自行研究並在投資前尋求專業建議。
熱議股票

沒有相關數據