SUI Price Drops as Potential Death Cross Signals More Losses
- SUI price declines over 3.5%, with market cap at $13.4B, ranking it 14th among biggest cryptos.
- Technical indicators like CMF and EMA highlight selling pressure and bearish momentum.
- ADX signals growing downtrend strength, with key support levels at $4.38 and $4.11.
SUI price has declined more than 3.5% in the last 24 hours, bringing its market cap to $13.4 billion, currently ranking it as the 14th largest crypto. Recent technical indicators paint a bearish picture, with the Chaikin Money Flow (CMF) turning negative and the Average Directional Index (ADX) signaling growing momentum within the ongoing downtrend.
Additionally, a death cross in SUI’s EMA lines shows the persistent downward pressure. Key support and resistance levels will play a pivotal role in determining whether SUI continues its descent or manages to reverse the current trend.
SUI CMF Dropped Heavily
SUI CMF (Chaikin Money Flow) has dropped to -0.15, down significantly from 0.10 just three days ago, indicating a notable shift in market sentiment. The CMF turning negative for two consecutive days suggests that selling pressure outweighs buying pressure, as more capital is flowing out of SUI.
This decline in CMF aligns with a bearish outlook, signaling reduced investor confidence and the possibility of continued price weakness.
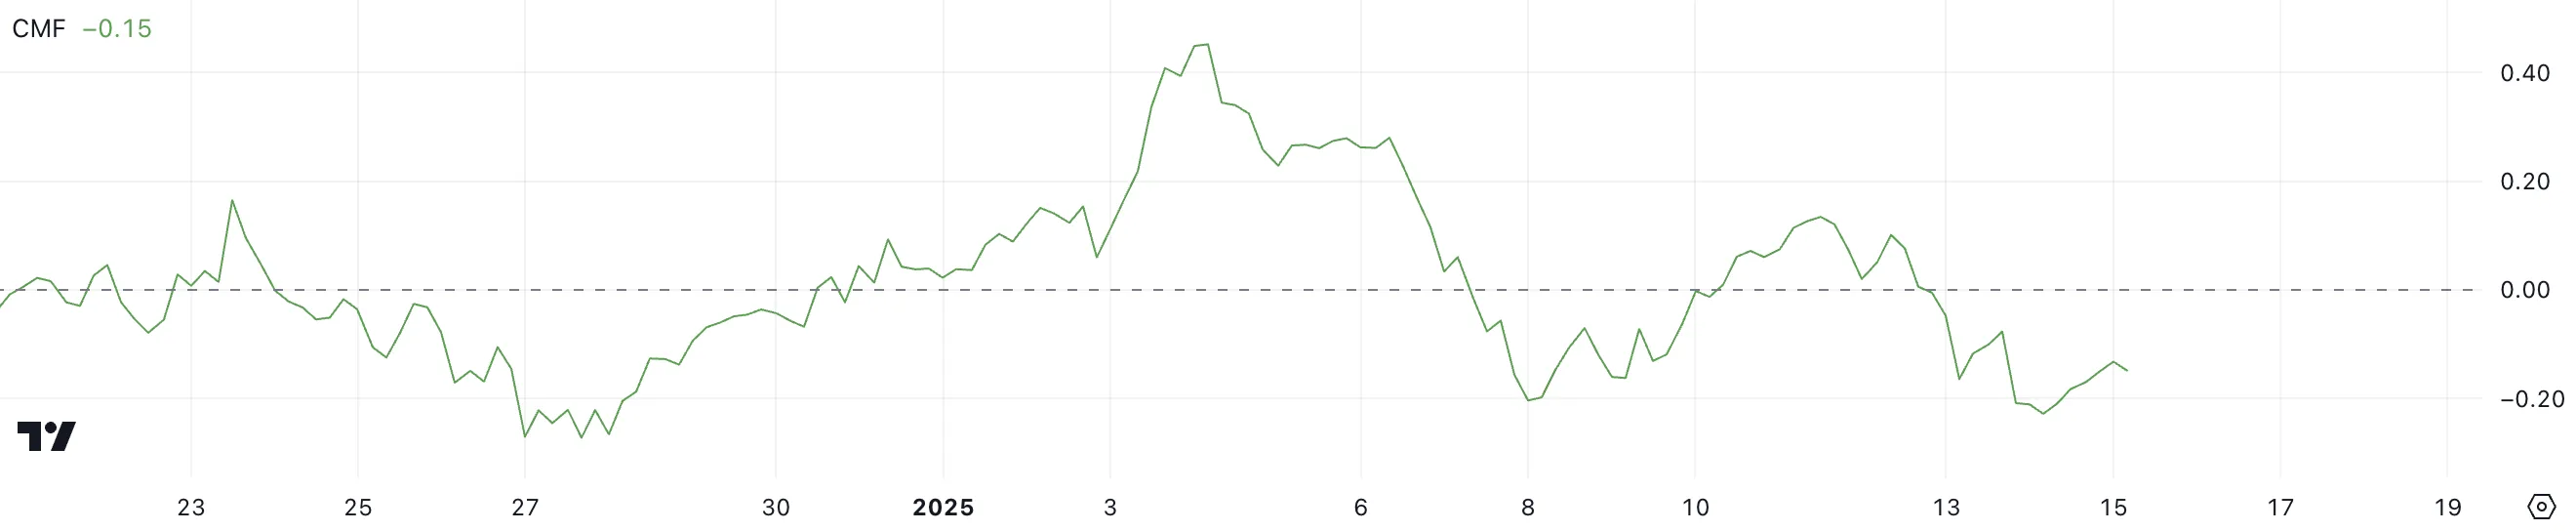
The CMF is a momentum indicator that measures the volume-weighted average flow of capital into or out of an asset. Values above zero indicate positive money flow, suggesting accumulation or buying dominance, while values below zero reflect negative money flow, indicating distribution or selling dominance.
With SUI CMF currently at -0.15, the persistent negative reading highlights sustained selling pressure, which could lead to further downward price movement unless buying momentum returns to counteract the current trend.
SUI Downtrend Is Getting Stronger
SUI ADX has risen to 19.7 from 12.9 over the past three days, signaling a strengthening trend. While an ADX below 20 still indicates a weak trend, the upward movement suggests that momentum is building, even though the current trend is bearish.
This increase highlights the possibility that the ongoing downtrend could become more defined if selling pressure continues to dominate.
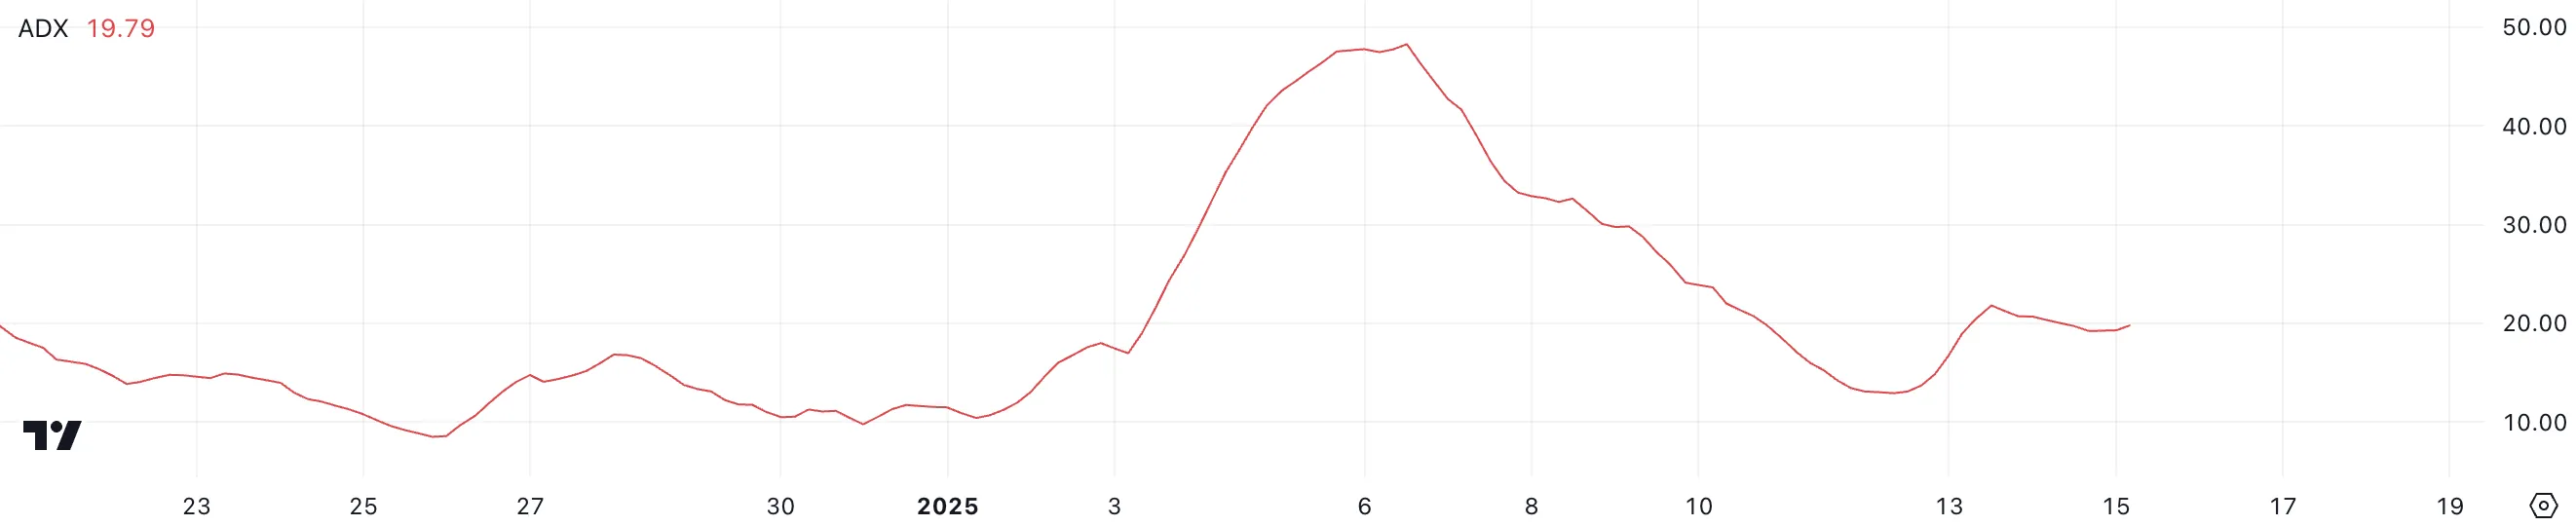
The ADX, or Average Directional Index, measures the strength of a trend without indicating its direction. Values below 20 signify a weak trend, and values above 25 indicate a strong, established trend. For SUI, the rise in ADX to 19.7 reflects growing directional momentum within the current downtrend.
If the ADX crosses above 25, it would confirm the downtrend’s strength, potentially leading to further price declines unless buying pressure emerges to reverse the trend.
SUI Price Prediction: Can It Fall Below $4?
SUI EMA lines indicate a bearish setup, with a death cross forming yesterday as its shorter-term EMA crossed below its longer-term EMA.
The current trajectory of the shortest-term EMA suggests that another death cross could occur soon, reinforcing the bearish sentiment. This alignment reflects persistent downward momentum, aligning with the ongoing downtrend in SUI price.
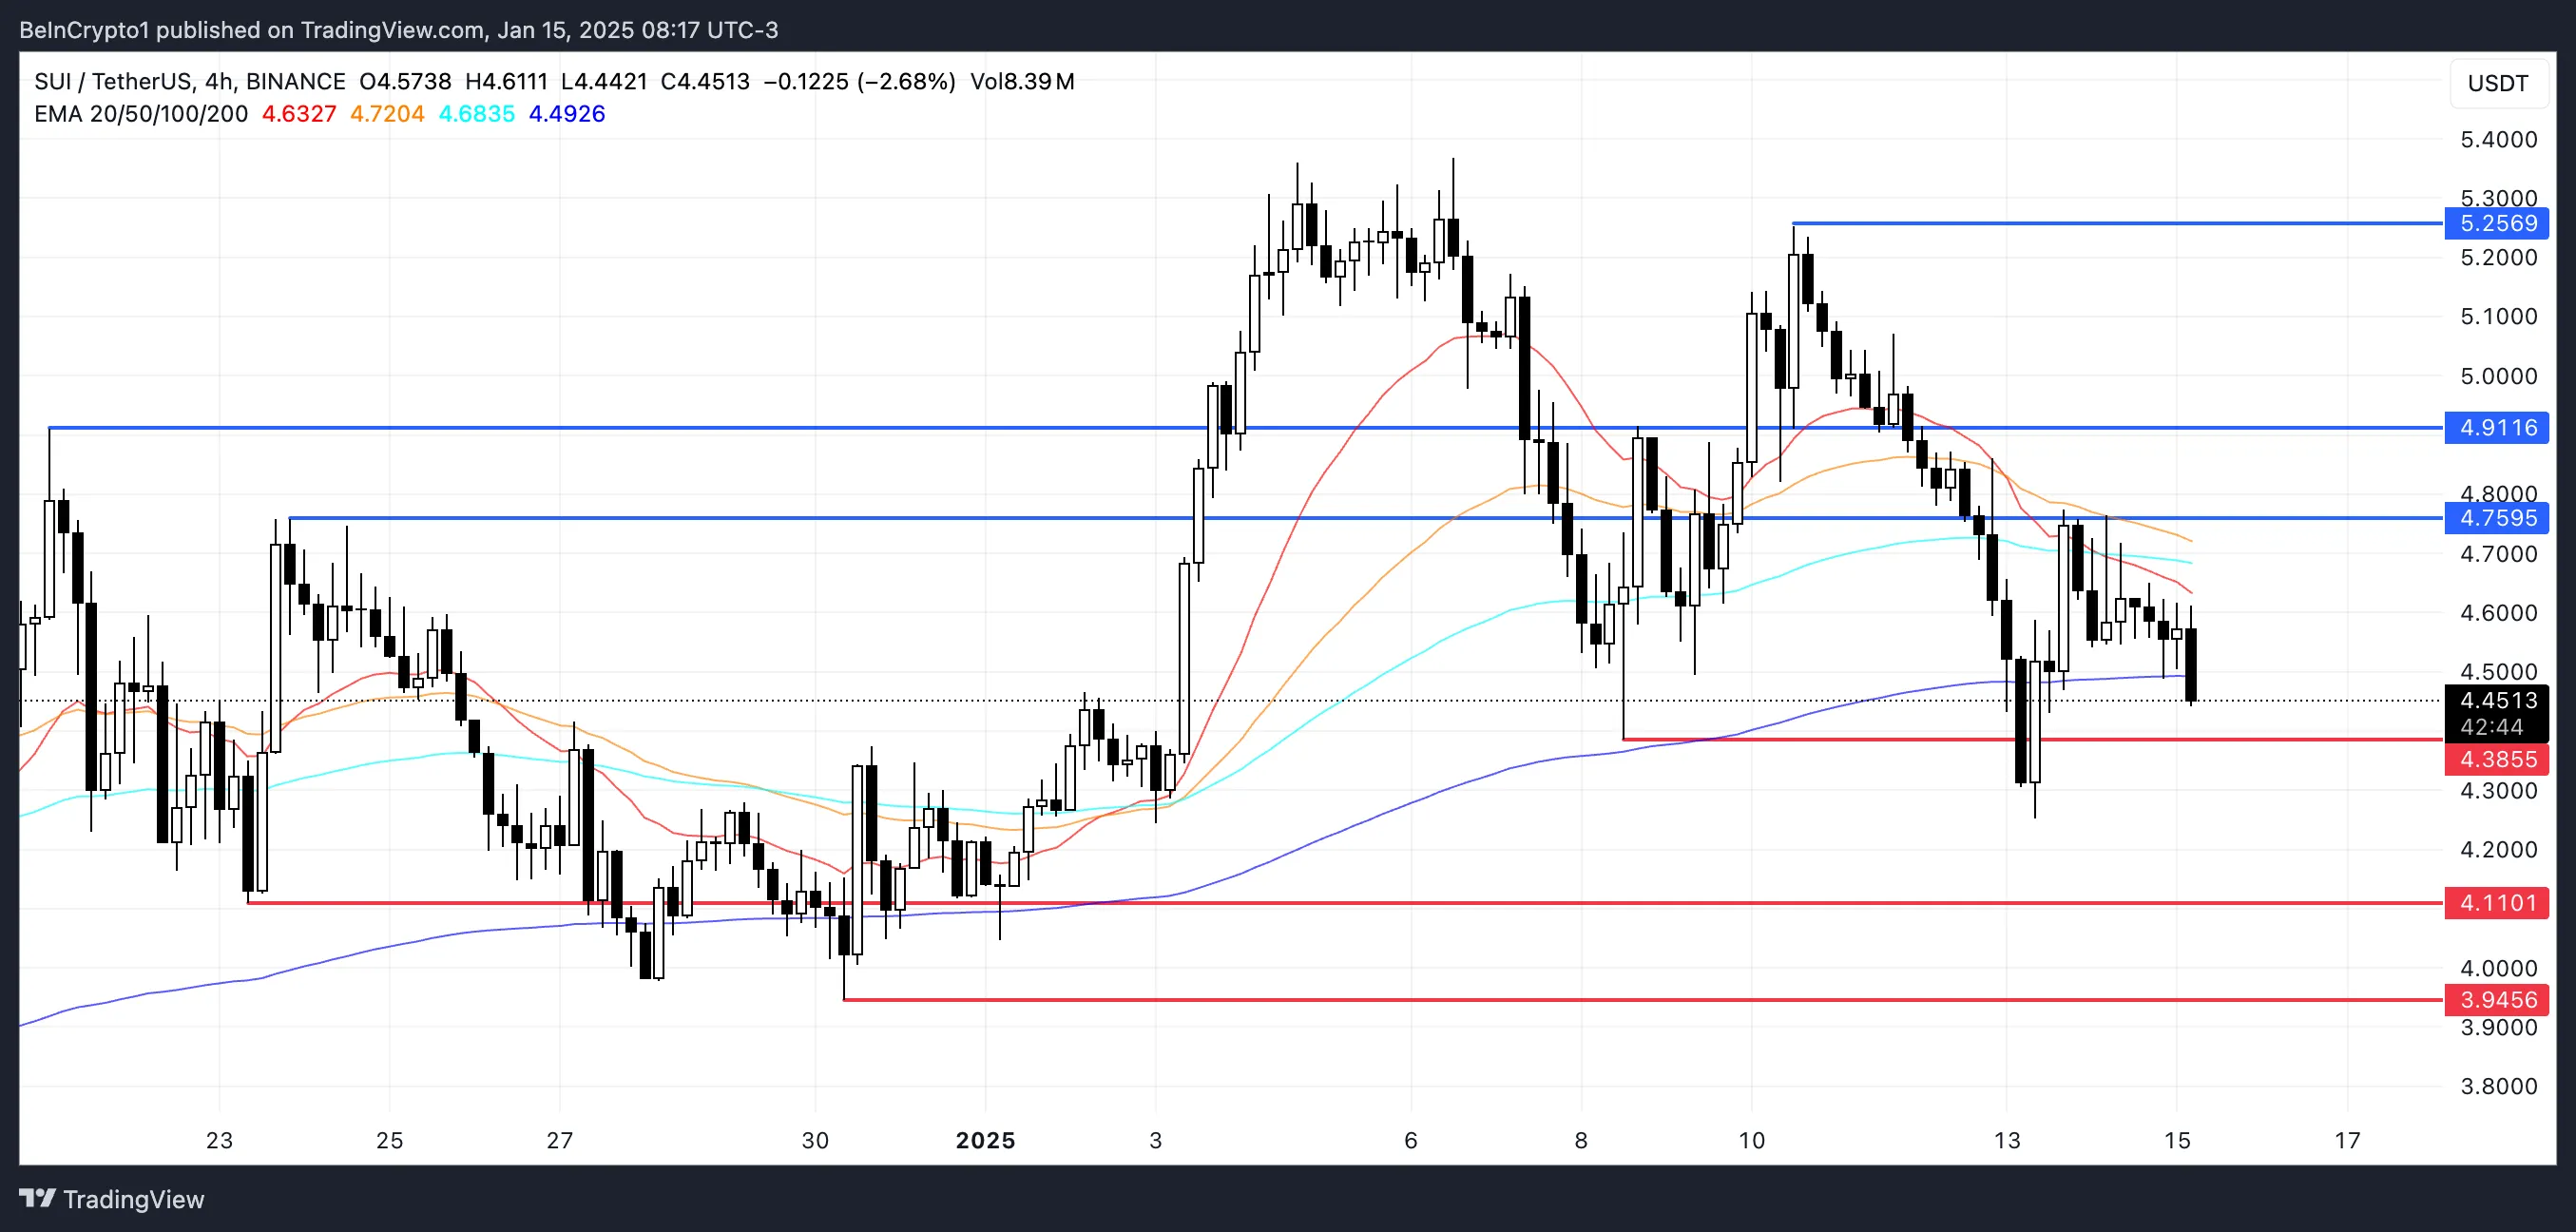
If the current downtrend persists, SUI could test the support at $4.38. Failure to hold this level may lead to further declines, with $4.11 as the next key support. A break below that could push SUI below the $4 threshold, testing $3.94.
Conversely, if the trend reverses, SUI could test the resistance at $4.75, and breaking that could open the door to $4.91. Should the uptrend gain enough strength, SUI price could potentially surpass the $5 barrier and test $5.25.
免責聲明:投資有風險,本文並非投資建議,以上內容不應被視為任何金融產品的購買或出售要約、建議或邀請,作者或其他用戶的任何相關討論、評論或帖子也不應被視為此類內容。本文僅供一般參考,不考慮您的個人投資目標、財務狀況或需求。TTM對信息的準確性和完整性不承擔任何責任或保證,投資者應自行研究並在投資前尋求專業建議。
熱議股票
- 1
- 2
- 3
- 4
- 5
- 6
- 7
- 8
- 9
- 10