LTC Price Soars 12% in 24 Hours as Rumors Around Litecoin ETF Intensify
- Litecoin price has surged over 12% in 24 hours, fueled by a golden cross and strong accumulation, pushing its market cap above $10 billion.
- Momentum indicators like RSI and CMF suggest bullish conditions, with buying pressure driving LTC to its highest levels in over a month.
- LTC could see further gains if the uptrend continues, but overbought RSI signals the possibility of a short-term correction.
Litecoin (LTC) price has surged more than 12% in the last 24 hours as Nasdaq filed an application to list Canary Capital’s Litecoin ETF. This rally has been fueled by bullish technical signals, including a golden cross formation and a significant rise in buying pressure, as reflected in key momentum indicators.
LTC’s RSI has climbed into overbought territory, and its CMF is at its highest level since December 2024, signaling strong accumulation by investors. With momentum building, LTC could test key resistance levels, potentially reaching its highest price in over a month if the uptrend continues.
Litecoin RSI Indicates Overbought Conditions
Litecoin RSI (Relative Strength Index) has climbed quickly, currently sitting at 75.4, up from 24.4 just four days ago. Yesterday, it peaked at 83.5, entering overbought territory for the first time since December 3. The RSI is a momentum oscillator that measures the speed and change of price movements on a scale from 0 to 100.
Typically, an RSI above 70 indicates overbought conditions, suggesting the asset may be overvalued and due for a correction, while an RSI below 30 signals oversold conditions, potentially indicating undervaluation.
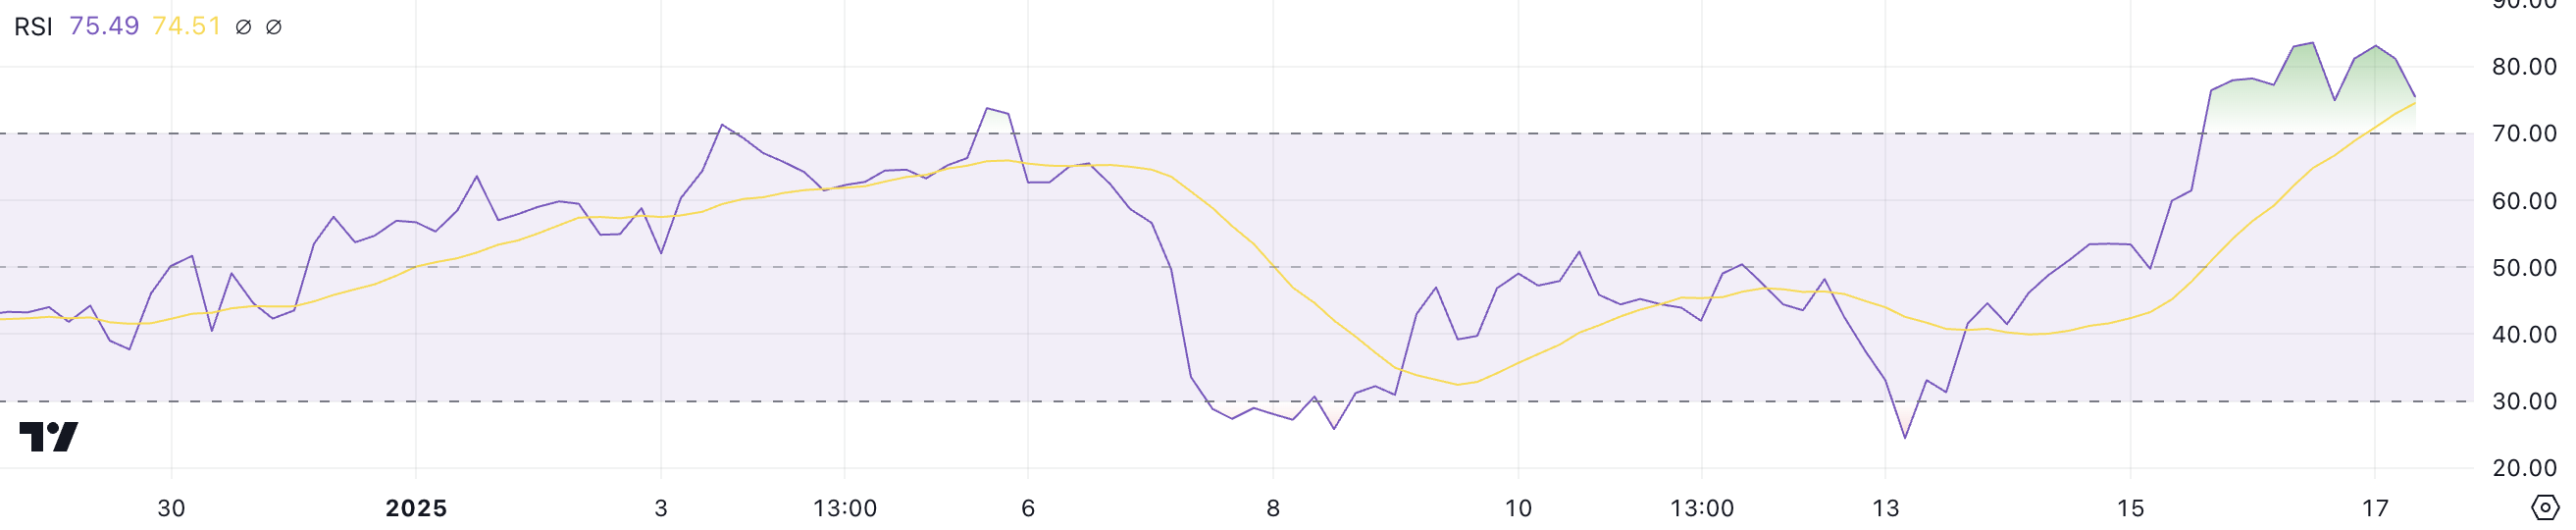
With Litecoin RSI currently at 75.4, the asset is still in overbought territory. This could signal a cooling-off period or short-term pullback if momentum slows. However, strong bullish momentum often keeps the RSI elevated for extended periods, suggesting the possibility of continued upward movement.
If buying pressure persists, LTC price could see further price gains before any significant retracement occurs, but traders should watch for signs of weakening momentum to anticipate potential corrections.
LTC CMF Points at Buying Pressure
CMF (Chaikin Money Flow) for LTC is currently at 0.32 after reaching a peak of 0.39 a few hours ago, up from -0.1 just four days ago. The CMF is an indicator that measures the flow of money into and out of an asset over a specific period, using both price and volume data.
Values above 0 indicate net buying pressure, while values below 0 suggest net selling pressure. A higher CMF value typically signals strong accumulation, which is often a bullish sign for price action.
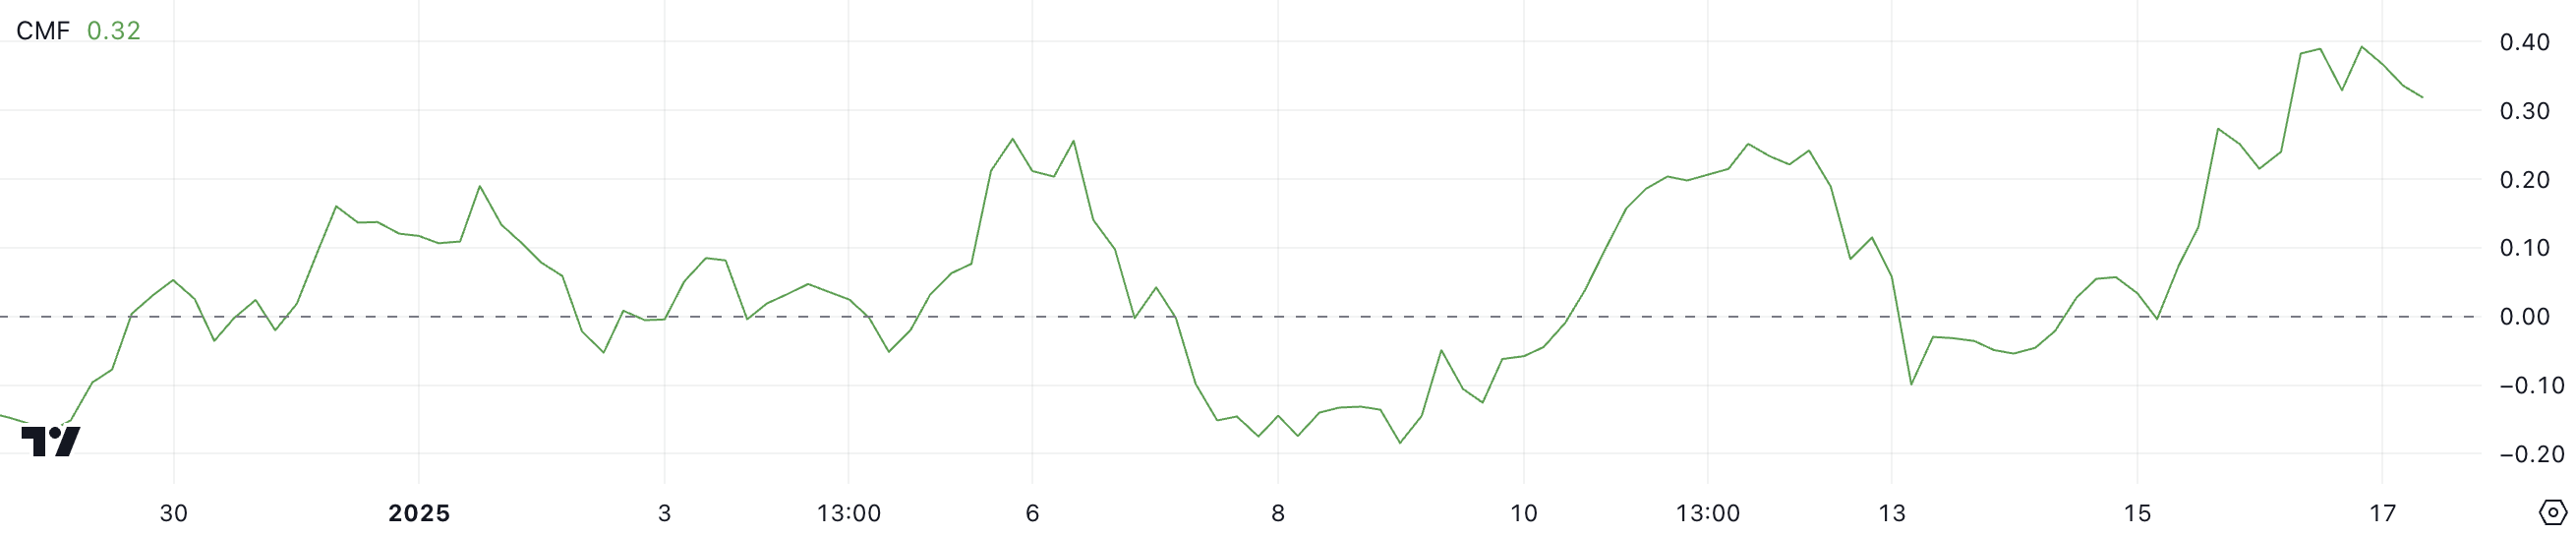
At 0.32, with a recent peak of 0.39, Litecoin CMF is at its highest level since December 1, 2024, reflecting significant buying pressure. These elevated levels suggest strong confidence among investors, which could support further price increases in the short term.
However, if CMF begins to decline, it may indicate waning accumulation, potentially signaling a cooling-off period for LTC’s price momentum.
LTC Price Prediction: Will Litecoin Reclaim December’s Highs?
Litecoin price formed a golden cross just one day ago, igniting its current uptrend and boosting bullish sentiment. A golden cross occurs when a short-term moving average crosses above a long-term moving average, often signaling the start of a strong upward price movement.
If this momentum continues, LTC could test the next resistance at $139, and breaking that level could push the price to $147, marking its highest point since early December 2024. The next news and movements around its ETF could also influence LTC price.
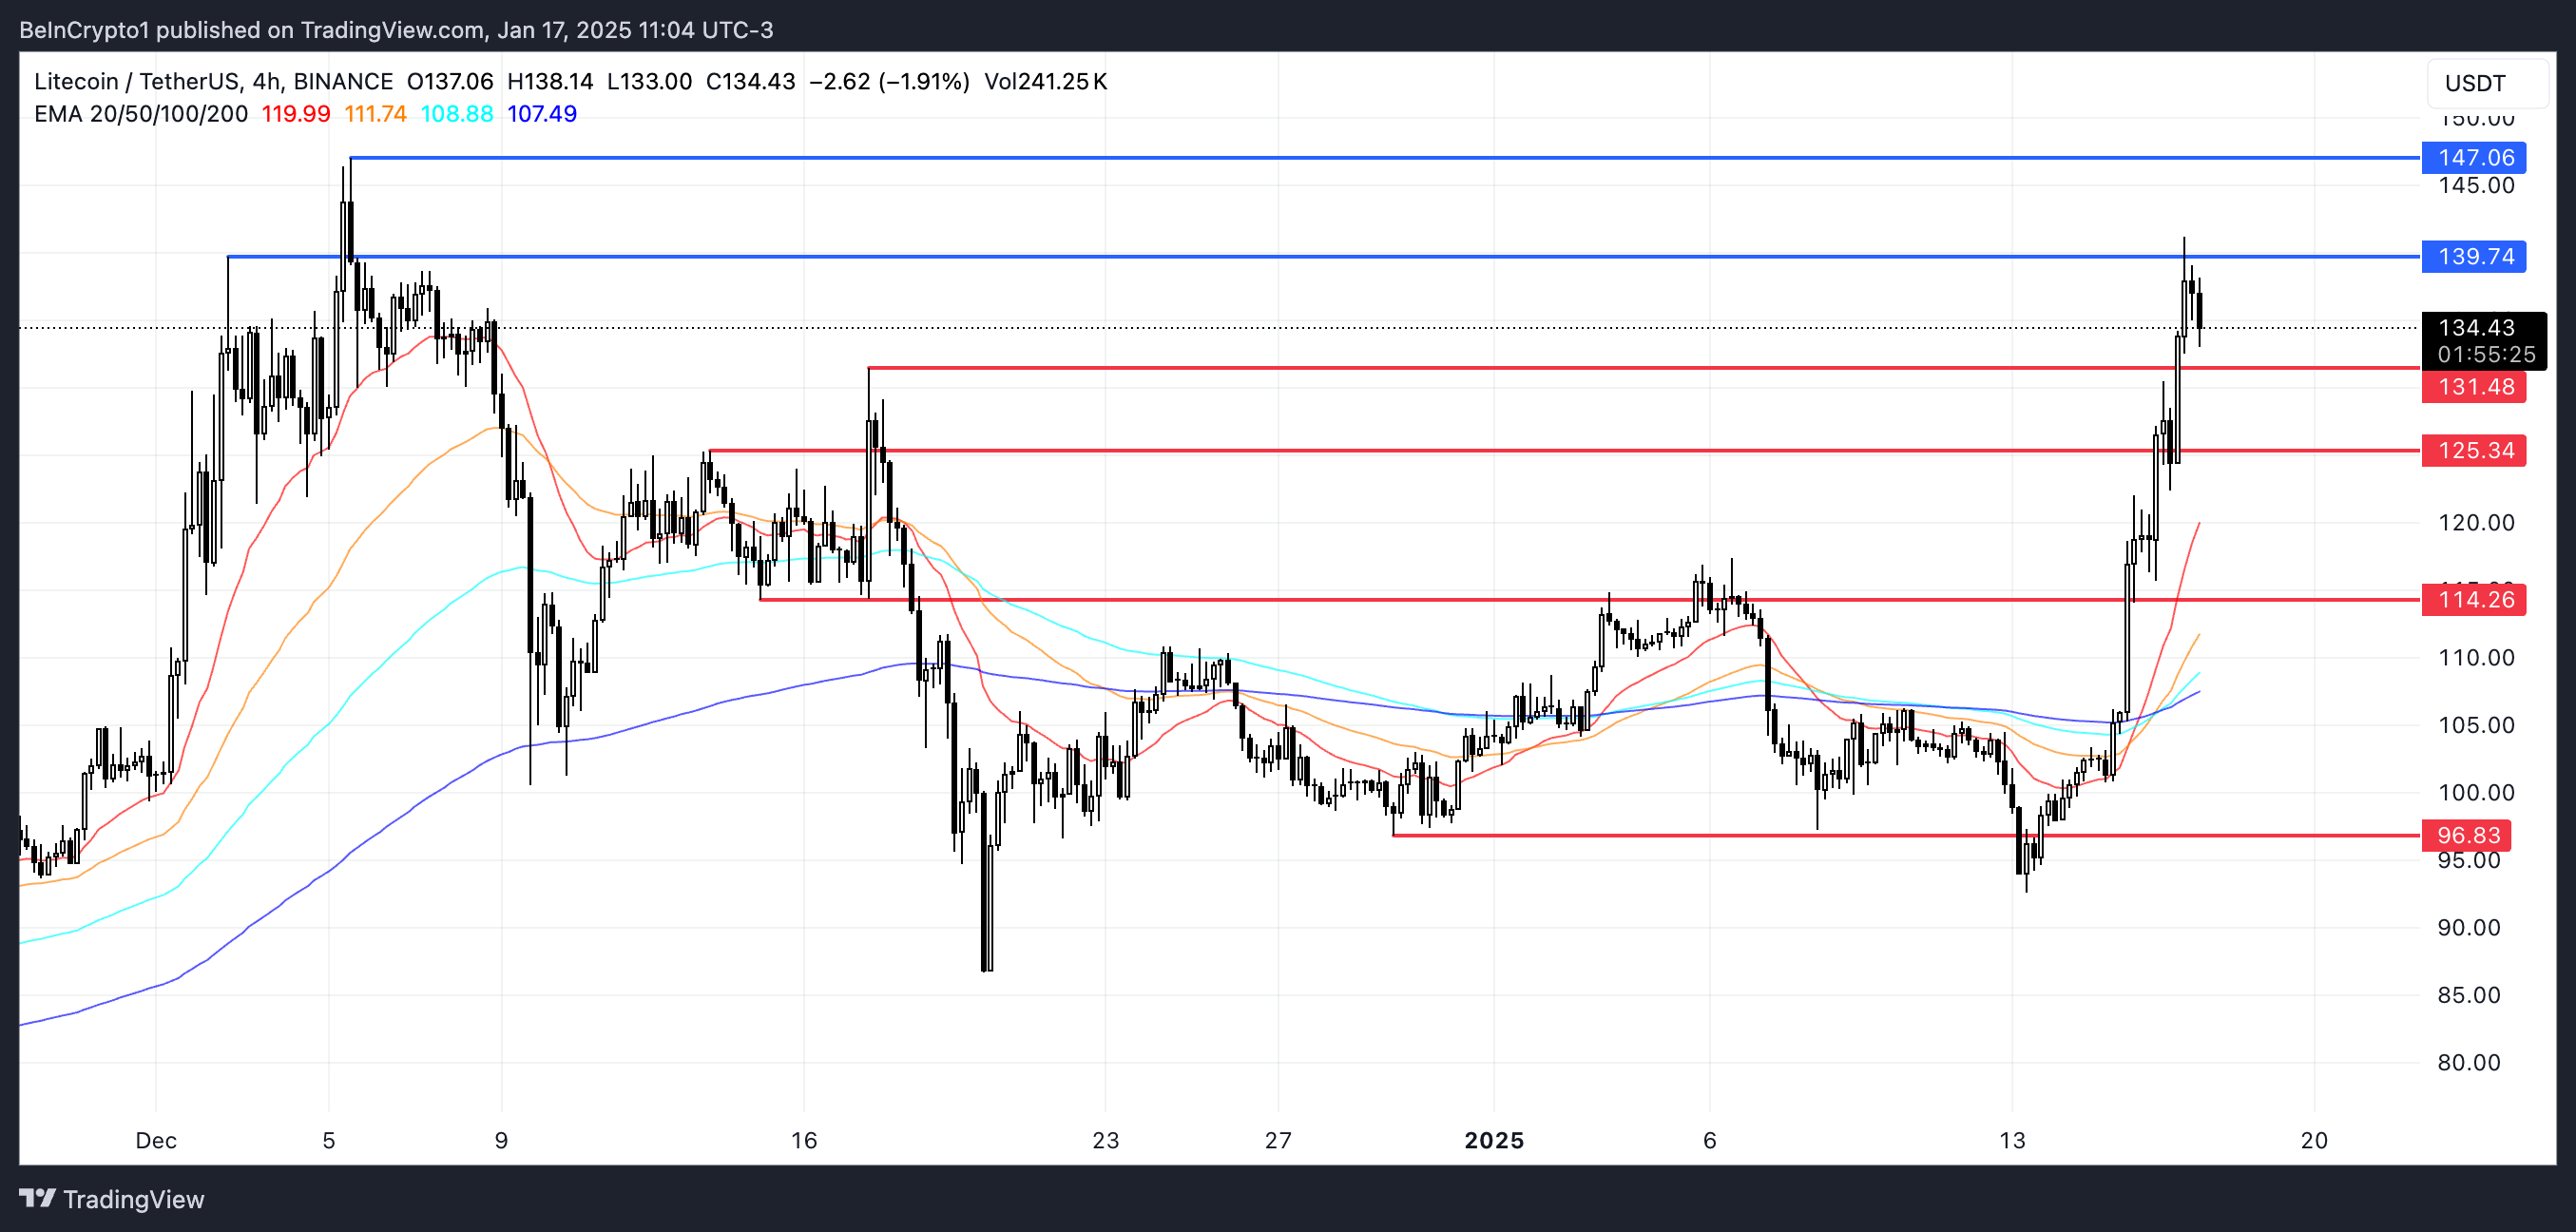
However, if the uptrend loses steam and the support at $131 is tested but fails to hold, LTC price could drop to $125. In the event of a stronger downtrend, further declines could bring the price as low as $114 or even below $100, with a potential test of support at $96.8, representing a 28.3% correction.
免責聲明:投資有風險,本文並非投資建議,以上內容不應被視為任何金融產品的購買或出售要約、建議或邀請,作者或其他用戶的任何相關討論、評論或帖子也不應被視為此類內容。本文僅供一般參考,不考慮您的個人投資目標、財務狀況或需求。TTM對信息的準確性和完整性不承擔任何責任或保證,投資者應自行研究並在投資前尋求專業建議。
熱議股票
- 1
- 2
- 3
- 4
- 5
- 6
- 7
- 8
- 9
- 10