Chart Industries (NYSE:GTLS) Is Looking To Continue Growing Its Returns On Capital
Did you know there are some financial metrics that can provide clues of a potential multi-bagger? Ideally, a business will show two trends; firstly a growing return on capital employed (ROCE) and secondly, an increasing amount of capital employed. Ultimately, this demonstrates that it's a business that is reinvesting profits at increasing rates of return. So on that note, Chart Industries (NYSE:GTLS) looks quite promising in regards to its trends of return on capital.
Understanding Return On Capital Employed (ROCE)
Just to clarify if you're unsure, ROCE is a metric for evaluating how much pre-tax income (in percentage terms) a company earns on the capital invested in its business. Analysts use this formula to calculate it for Chart Industries:
Return on Capital Employed = Earnings Before Interest and Tax (EBIT) ÷ (Total Assets - Current Liabilities)
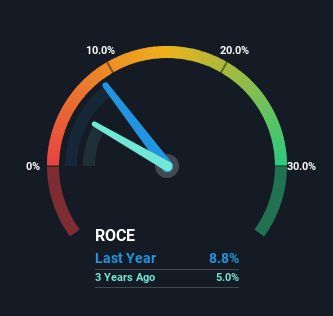
0.088 = US$658m ÷ (US$9.5b - US$2.0b) (Based on the trailing twelve months to September 2024).
Therefore, Chart Industries has an ROCE of 8.8%. In absolute terms, that's a low return and it also under-performs the Machinery industry average of 12%.
View our latest analysis for Chart Industries
Above you can see how the current ROCE for Chart Industries compares to its prior returns on capital, but there's only so much you can tell from the past. If you'd like to see what analysts are forecasting going forward, you should check out our free analyst report for Chart Industries .
What Does the ROCE Trend For Chart Industries Tell Us?
Even though ROCE is still low in absolute terms, it's good to see it's heading in the right direction. Over the last five years, returns on capital employed have risen substantially to 8.8%. Basically the business is earning more per dollar of capital invested and in addition to that, 253% more capital is being employed now too. The increasing returns on a growing amount of capital is common amongst multi-baggers and that's why we're impressed.
In Conclusion...
A company that is growing its returns on capital and can consistently reinvest in itself is a highly sought after trait, and that's what Chart Industries has. And with the stock having performed exceptionally well over the last five years, these patterns are being accounted for by investors. So given the stock has proven it has promising trends, it's worth researching the company further to see if these trends are likely to persist.
Chart Industries does have some risks though, and we've spotted 1 warning sign for Chart Industries that you might be interested in.
For those who like to invest in solid companies, check out this free list of companies with solid balance sheets and high returns on equity.
New: AI Stock Screener & Alerts
Our new AI Stock Screener scans the market every day to uncover opportunities.
• Dividend Powerhouses (3%+ Yield)• Undervalued Small Caps with Insider Buying• High growth Tech and AI CompaniesOr build your own from over 50 metrics.
Explore Now for FreeHave feedback on this article? Concerned about the content? Get in touch with us directly. Alternatively, email editorial-team (at) simplywallst.com.This article by Simply Wall St is general in nature. We provide commentary based on historical data and analyst forecasts only using an unbiased methodology and our articles are not intended to be financial advice. It does not constitute a recommendation to buy or sell any stock, and does not take account of your objectives, or your financial situation. We aim to bring you long-term focused analysis driven by fundamental data. Note that our analysis may not factor in the latest price-sensitive company announcements or qualitative material. Simply Wall St has no position in any stocks mentioned.
免責聲明:投資有風險,本文並非投資建議,以上內容不應被視為任何金融產品的購買或出售要約、建議或邀請,作者或其他用戶的任何相關討論、評論或帖子也不應被視為此類內容。本文僅供一般參考,不考慮您的個人投資目標、財務狀況或需求。TTM對信息的準確性和完整性不承擔任何責任或保證,投資者應自行研究並在投資前尋求專業建議。
熱議股票
- 1
- 2
- 3
- 4
- 5
- 6
- 7
- 8
- 9
- 10