TRUMP Price Down 27% One Day After Donald Trump’s Inauguration
- TRUMP price plunged 27% in 24 hours, with its market cap halving to $7.5 billion amid heightened consolidation volatility.
- RSI at 46.8 reflects neutral momentum, while ADX at 14.4 signals weak trend strength and potential for breakout or breakdown.
- Key levels to watch are $45 resistance for an 88% upside to $71.8 and $30.3 support, with a 59% downside risk to $15.43 if breached.
TRUMP price has plunged over 27% in the last 24 hours, with its market cap now at $7.5 billion, down from nearly $15 billion just two days ago. This sharp decline comes amid heightened volatility, as the coin trades within a consolidation range between $30.3 support and $45 resistance.
While technical indicators like RSI and ADX suggest neutral momentum and a lack of clear trend, the potential for a significant breakout or breakdown remains high. If TRUMP recovers its uptrend, it could aim for an 88% upside to $71.8, but losing key support at $30.3 could lead to a steep correction toward $15.43.
TRUMP RSI Is Currently Neutral
TRUMP RSI currently stands at 46.8, rising sharply from 30 just yesterday, signaling a swift recovery from oversold conditions, after touching 67 a few hours ago.
The movement toward the 50 level indicates momentum is neutral, but the token’s position still suggests caution as it remains below the threshold for a clear bullish trend.
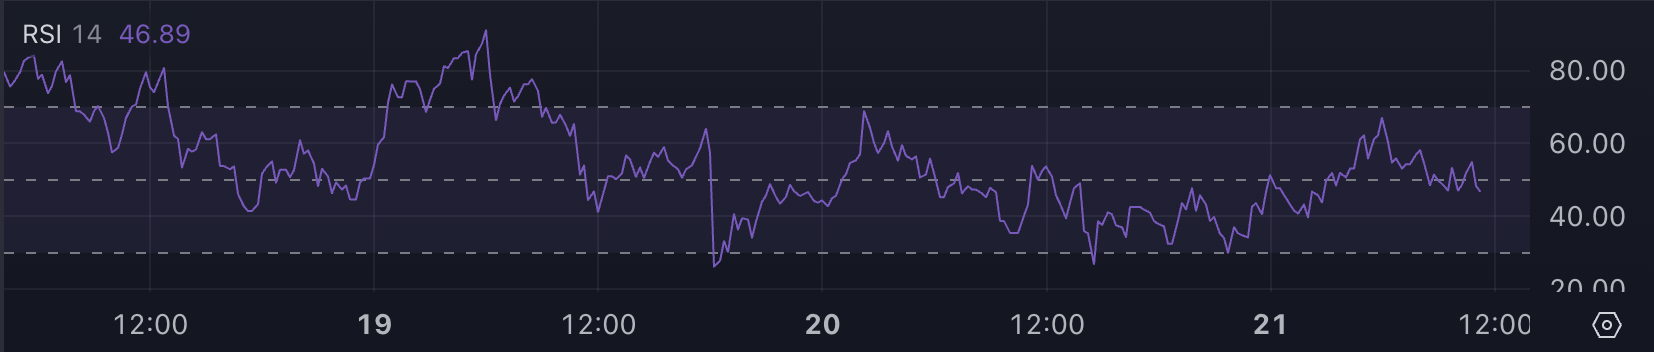
The Relative Strength Index (RSI) is a technical indicator used to measure the speed and magnitude of price movements to evaluate market momentum. It ranges from 0 to 100, with values above 70 indicating overbought conditions, often preceding a price correction, and values below 30 signaling oversold conditions, which can suggest a potential recovery.
At 46.8, TRUMP RSI reflects a neutral stage, indicating the potential for price stabilization or gradual growth. However, the token needs to break above 50 to signal stronger bullish momentum and reinforce confidence in a sustained upward trend.
TRUMP ADX Shows An Undefined Trend
TRUMP ADX is currently at 14.4, dropping significantly from 46 just yesterday. This sharp decline indicates a substantial weakening in trend strength, as the coin moves sideways without a clear directional bias.
The low ADX level suggests that TRUMP is experiencing reduced volatility and indecisive market behavior in the short term.
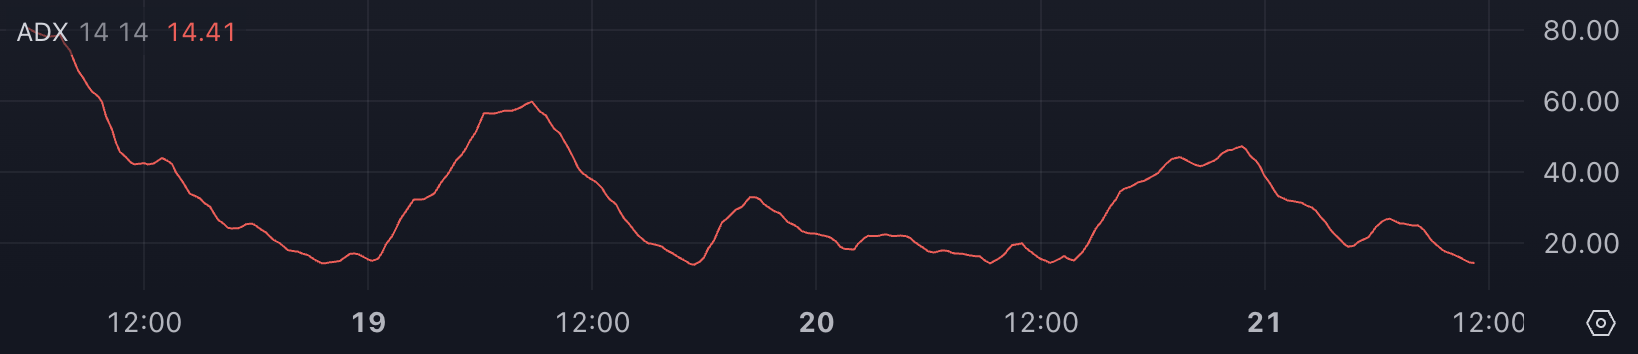
The Average Directional Index (ADX) measures the strength of a trend, regardless of its direction, on a scale from 0 to 100. Readings above 25 typically signify a strong trend, while values below 20 indicate a weak or nonexistent trend. With TRUMP ADX at 14.4, the token’s price movement is currently directionless, reflecting a consolidation phase.
This sideways action could either precede a breakout as momentum rebuilds or extend further if traders remain hesitant to commit to a definitive trend.
TRUMP Price Prediction: Will TRUMP Further Correct By 59%?
TRUMP is currently trading in a range defined by resistance at $45 and support at $30.30, reflecting a period of consolidation. If the token regains its uptrend and positive momentum, it could test the $45 resistance level.
A breakout above this level could open the door for a rally to $64.50, and further strength might propel TRUMP to $71.80, representing a potential upside of 88% from current levels and making it one of the top 3 meme coins in the market.
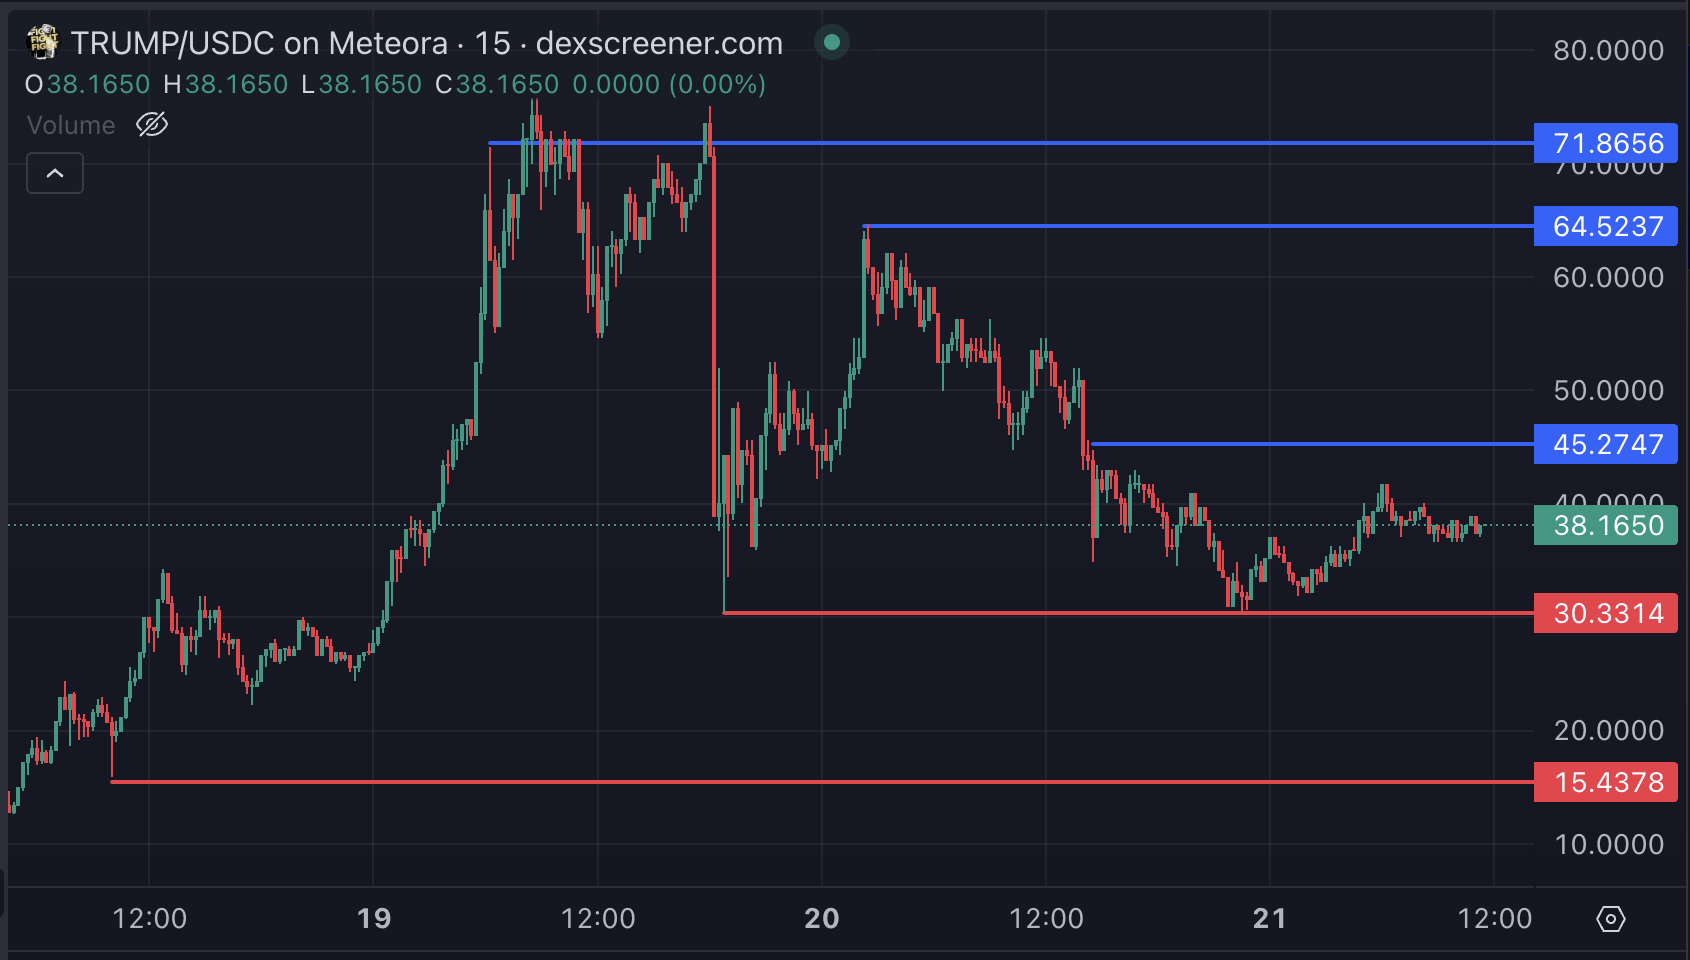
Conversely, if TRUMP price tests the $30.30 support and fails to hold above it, the price could face a steep correction. Breaking below this support might drive the token down to $15.43, representing a potential 59% decline.
免責聲明:投資有風險,本文並非投資建議,以上內容不應被視為任何金融產品的購買或出售要約、建議或邀請,作者或其他用戶的任何相關討論、評論或帖子也不應被視為此類內容。本文僅供一般參考,不考慮您的個人投資目標、財務狀況或需求。TTM對信息的準確性和完整性不承擔任何責任或保證,投資者應自行研究並在投資前尋求專業建議。
熱議股票
- 1
- 2
- 3
- 4
- 5
- 6
- 7
- 8
- 9
- 10