Angelalign Technology Among 3 Stocks That Might Be Trading Below Estimated Value
As global markets show signs of optimism with cooling inflation and robust bank earnings driving U.S. stocks higher, investors are increasingly on the lookout for opportunities in undervalued stocks. In this environment, identifying companies that may be trading below their estimated value can offer potential for growth, especially if they demonstrate strong fundamentals or are positioned to benefit from prevailing economic trends.
Top 10 Undervalued Stocks Based On Cash Flows
| Name | Current Price | Fair Value (Est) | Discount (Est) |
| Türkiye Sise Ve Cam Fabrikalari (IBSE:SISE) | TRY38.94 | TRY77.88 | 50% |
| Aidma Holdings (TSE:7373) | ¥1810.00 | ¥3616.14 | 49.9% |
| Tabuk Cement (SASE:3090) | SAR13.46 | SAR26.85 | 49.9% |
| Fevertree Drinks (AIM:FEVR) | £6.595 | £13.12 | 49.7% |
| World Fitness Services (TWSE:2762) | NT$92.60 | NT$183.67 | 49.6% |
| CYND (TSE:4256) | ¥1055.00 | ¥2100.49 | 49.8% |
| Mentice (OM:MNTC) | SEK25.10 | SEK49.91 | 49.7% |
| Greenworks (Jiangsu) (SZSE:301260) | CN¥14.00 | CN¥27.77 | 49.6% |
| Verra Mobility (NasdaqCM:VRRM) | US$26.08 | US$52.02 | 49.9% |
| Shinko Electric Industries (TSE:6967) | ¥5879.00 | ¥11701.41 | 49.8% |
Click here to see the full list of 878 stocks from our Undervalued Stocks Based On Cash Flows screener.
Here we highlight a subset of our preferred stocks from the screener.
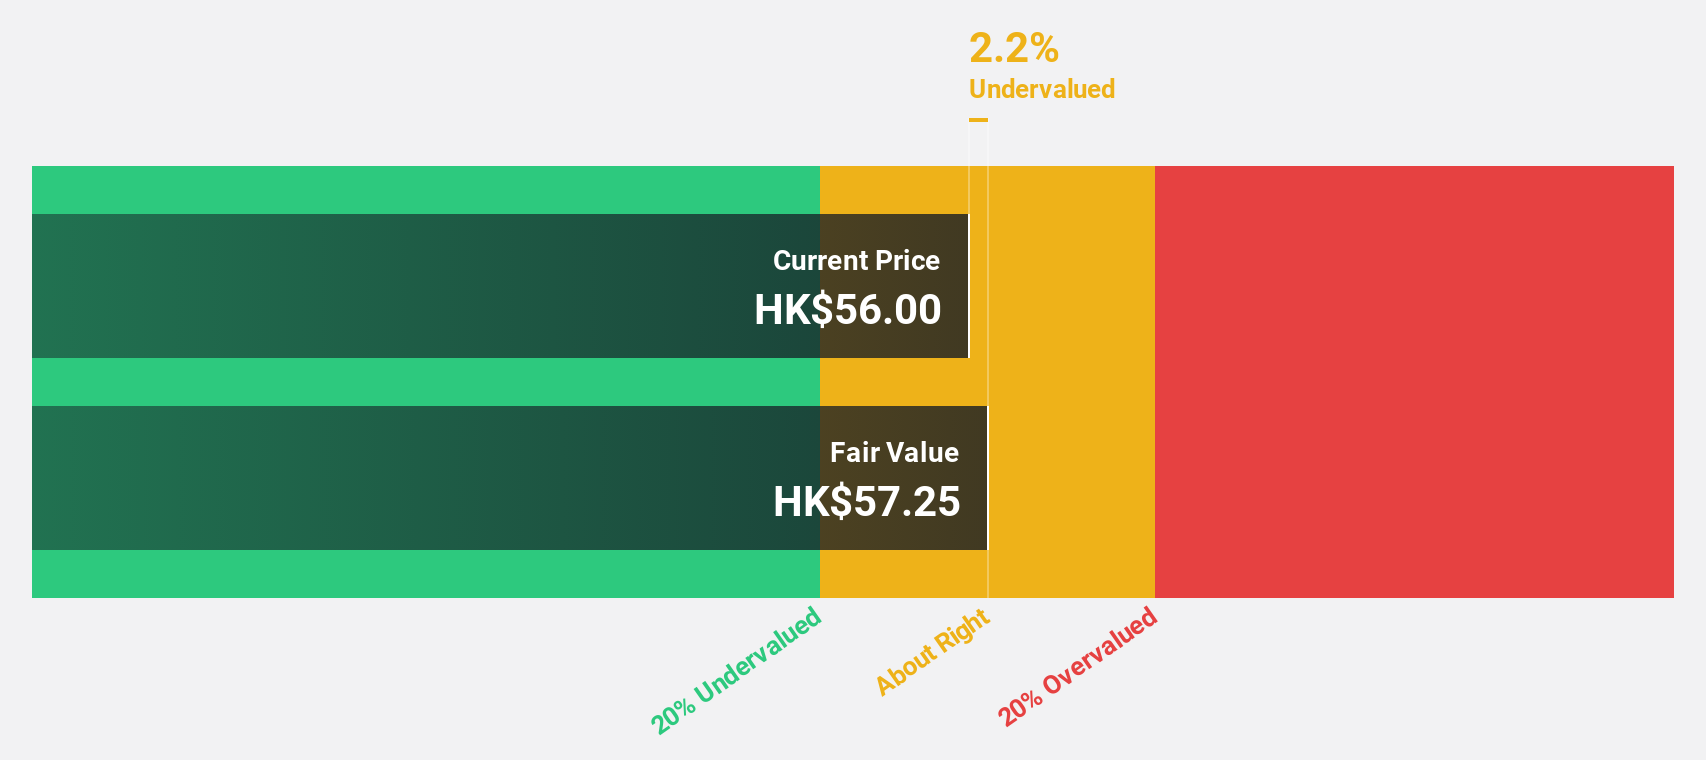
Angelalign Technology (SEHK:6699)
Overview: Angelalign Technology Inc. is an investment holding company that focuses on the research, development, design, manufacturing, and marketing of clear aligner treatment solutions in the People's Republic of China with a market cap of HK$8.98 billion.
Operations: The company generates revenue from the Dental Equipment & Supplies segment, amounting to CN¥1.72 billion.
Estimated Discount To Fair Value: 32.7%
Angelalign Technology is trading at HK$52.8, significantly below its fair value estimate of HK$78.46, suggesting it may be undervalued based on cash flows. Earnings are projected to grow substantially at 69.6% annually, outpacing the Hong Kong market's growth rate of 11.3%. However, profit margins have declined from 13.1% to 2.5%, and return on equity is expected to remain low at 6.7%. Despite these challenges, analysts anticipate a potential price increase of 56%.
- The analysis detailed in our Angelalign Technology growth report hints at robust future financial performance.
- Click here and access our complete balance sheet health report to understand the dynamics of Angelalign Technology.
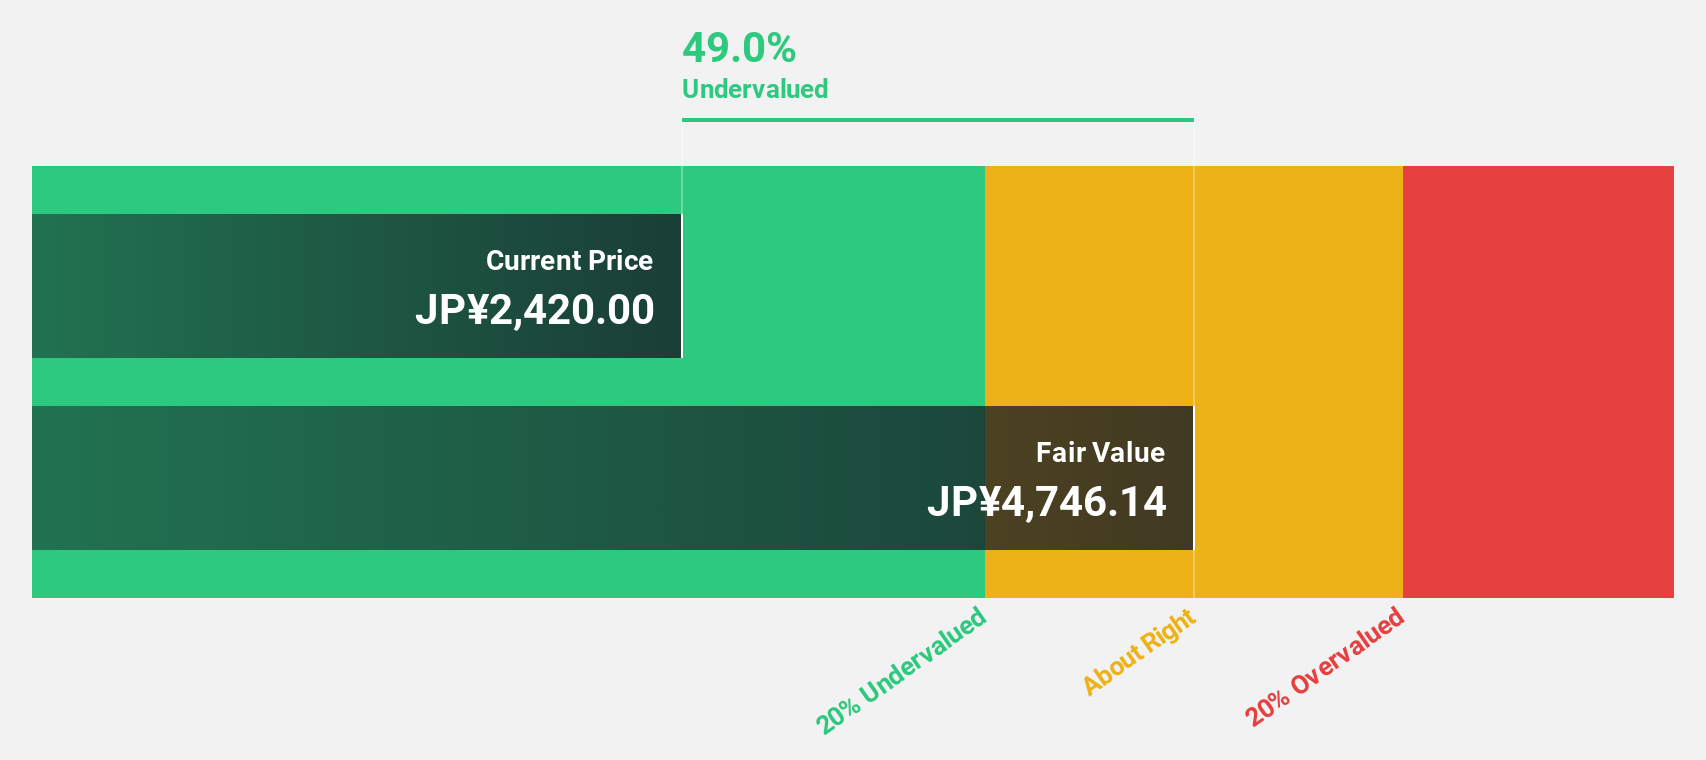
Taiyo Yuden (TSE:6976)
Overview: Taiyo Yuden Co., Ltd. is engaged in the development, manufacturing, and sale of electronic components across Japan, China, Hong Kong, and internationally with a market capitalization of approximately ¥282.83 billion.
Operations: The company's revenue is primarily generated from its Electronic Components Business, which accounts for ¥335.08 billion.
Estimated Discount To Fair Value: 40.7%
Taiyo Yuden, trading at ¥2267.5, is considerably below its estimated fair value of ¥3823.43, highlighting potential undervaluation based on cash flows. Despite a volatile share price and lowered earnings guidance for fiscal year 2025, the company's earnings are forecast to grow significantly at 34.9% annually, surpassing the Japanese market's growth rate of 8.1%. However, the dividend yield of 3.97% lacks coverage from earnings or free cash flows.
- Insights from our recent growth report point to a promising forecast for Taiyo Yuden's business outlook.
- Unlock comprehensive insights into our analysis of Taiyo Yuden stock in this financial health report.
Japan Investment Adviser (TSE:7172)
Overview: Japan Investment Adviser Co., Ltd. offers a range of financial solutions in Japan and has a market cap of ¥71.43 billion.
Operations: The company generates revenue primarily through its Finance Solution segment, which accounts for ¥28.10 billion.
Estimated Discount To Fair Value: 34.4%
Japan Investment Adviser, trading at ¥1181, is significantly below its estimated fair value of ¥1801.46, indicating potential undervaluation based on cash flows. Despite substantial shareholder dilution and a dividend yield of 2.03% not covered by free cash flows, earnings are forecast to grow at 56.2% annually, well above the Japanese market average of 8.1%. Recent executive changes aim to bolster strategic sales and renewable energy initiatives amid lowered earnings guidance due to yen appreciation impacts.
- Our earnings growth report unveils the potential for significant increases in Japan Investment Adviser's future results.
- Click to explore a detailed breakdown of our findings in Japan Investment Adviser's balance sheet health report.

Seize The Opportunity
- Navigate through the entire inventory of 878 Undervalued Stocks Based On Cash Flows here.
- Have a stake in these businesses? Integrate your holdings into Simply Wall St's portfolio for notifications and detailed stock reports.
- Maximize your investment potential with Simply Wall St, the comprehensive app that offers global market insights for free.
Looking For Alternative Opportunities?
- Explore high-performing small cap companies that haven't yet garnered significant analyst attention.
- Diversify your portfolio with solid dividend payers offering reliable income streams to weather potential market turbulence.
- Fuel your portfolio with companies showing strong growth potential, backed by optimistic outlooks both from analysts and management.
This article by Simply Wall St is general in nature. We provide commentary based on historical data and analyst forecasts only using an unbiased methodology and our articles are not intended to be financial advice. It does not constitute a recommendation to buy or sell any stock, and does not take account of your objectives, or your financial situation. We aim to bring you long-term focused analysis driven by fundamental data. Note that our analysis may not factor in the latest price-sensitive company announcements or qualitative material. Simply Wall St has no position in any stocks mentioned.
New: Manage All Your Stock Portfolios in One Place
We've created the ultimate portfolio companion for stock investors, and it's free.
• Connect an unlimited number of Portfolios and see your total in one currency• Be alerted to new Warning Signs or Risks via email or mobile• Track the Fair Value of your stocks
Try a Demo Portfolio for FreeHave feedback on this article? Concerned about the content? Get in touch with us directly. Alternatively, email editorial-team@simplywallst.com
免責聲明:投資有風險,本文並非投資建議,以上內容不應被視為任何金融產品的購買或出售要約、建議或邀請,作者或其他用戶的任何相關討論、評論或帖子也不應被視為此類內容。本文僅供一般參考,不考慮您的個人投資目標、財務狀況或需求。TTM對信息的準確性和完整性不承擔任何責任或保證,投資者應自行研究並在投資前尋求專業建議。
熱議股票
- 1
- 2
- 3
- 4
- 5
- 6
- 7
- 8
- 9
- 10