SPX6900 (SPX) Price Prediction 2025, 2026-2030
- Bullish SPX price prediction for 2025 is $1.8756 to $3.4857.
- SPX6900 (SPX) price might reach $5 soon.
- Bearish SPX price prediction for 2025 is $0.4945.
In this SPX6900 (SPX) price prediction 2025, 2026-2030, we will analyze the price patterns of SPX by using accurate trader-friendly technical analysis indicators and predict the future movement of the cryptocurrency.
|
TABLE OF CONTENTS
|
|
INTRODUCTION
|
|
|
(SPX)6900 PRICE PREDICTION 2025
|
|
| (SPX)6900 PRICE PREDICTION 2026, 2027-2030 |
| CONCLUSION |
| FAQ |
SPX6900 (SPX) Current Market Status
| Current Price | $1.31 |
| 24 – Hour Price Change | 1.01% Up |
| 24 – Hour Trading Volume | $77.72M |
| Market Cap | $1.21B |
| Circulating Supply | 930.99M SPX |
| All – Time High | $1.77 (On Jan 20, 2025) |
| All – Time Low | $0.000002634 (On Aug 16, 2023) |
What is SPX6900 (SPX)
| TICKER | SPX |
| BLOCKCHAIN | Ethereum |
| CATEGORY | Meme Coin |
| LAUNCHED ON | August 2023 |
| UTILITIES | Trading, Speculation, Community Engagement |
SPX6900 (SPX) is a meme-based cryptocurrency that operates primarily on the Ethereum blockchain, with availability on other platforms like Solana and Base. It has a total supply of 1 billion tokens, with a significant portion currently in circulation. The token has gained popularity due to its strong community engagement and social media presence, which significantly influence its market trends. SPX6900 is mainly used for speculative trading and investment, with availability on various exchanges, including decentralized platforms like Uniswap V2 and Aerodrome. As a meme coin, its value is highly susceptible to market sentiment and online trends, leading to rapid fluctuations in interest and price. Despite its speculative nature, the project continues to attract attention from traders seeking high-risk, high-reward opportunities. Investors should approach with caution and conduct thorough research before participating in the SPX6900 ecosystem.
SPX6900 24H Technicals
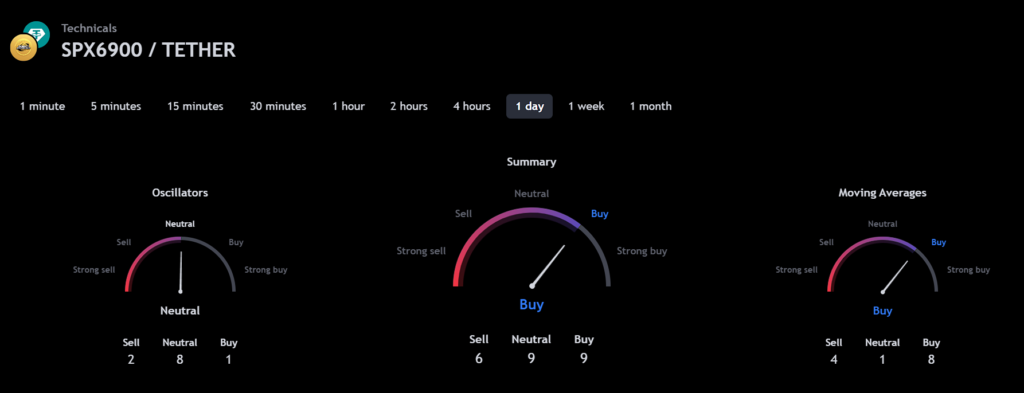
(Source: TradingView)
SPX6900 (SPX) Price Prediction 2025
SPX6900 (SPX) ranks 85th on CoinMarketCap in terms of its market capitalization. The overview of the SPX6900 price prediction for 2025 is explained below with a daily time frame.
SPX/USDT Cup and Handle Pattern (Source: TradingView)
In the above chart, SPX6900 (SPX) laid out a cup and handle pattern. A Cup and handle price pattern on a security’s price chart is a technical indicator that resembles a cup with a handle, where the cup is in the shape of a “u” and the handle has a slight downward drift. the cup and handle are considered a bullish signal, with the right-hand side of the pattern typically experiencing lower trading volume. A Cup and handle are considered a bullish signal extending an uptrend, and it is used to spot opportunities to go long. A cup and handle is a technical indicator where the price movement of security resembles a cup followed by a downward trending price pattern. This drop or handle is meant to signal a buying opportunity to go long on security.
At the time of analysis, SPX6900 (SPX) ‘s price was $1.31. If the pattern trend continues, then the price of SPX might reach the resistance levels of $1.7970, and $3.4505. If the trend reverses, then the price of SPX may fall to the support levels of $1.1751, and $0.8770.
SPX6900 (SPX) Resistance and Support Levels
The chart given below elucidates the possible resistance and support levels of SPX6900 (SPX) in 2025.
SPX/USDT Resistance and Support Levels (Source: TradingView)
From the above chart, we can analyze and identify the following as the resistance and support levels of SPX6900 (SPX) for 2025.
| Resistance Level 1 | $1.8756 |
| Resistance Level 2 | $3.4857 |
| Support Level 1 | $0.8841 |
| Support Level 2 | $0.4945 |
SPX Resistance & Support Levels
SPX6900 (SPX) Price Prediction 2025 — RVOL, MA, and RSI
The technical analysis indicators such as Relative Volume (RVOL), Moving Average (MA), and Relative Strength Index (RSI) of SPX6900 (SPX) are shown in the chart below.
SPX/USDT RVOL, MA, RSI (Source: TradingView)
From the readings on the chart above, we can make the following inferences regarding the current SPX6900 (SPX) market in 2025.
| INDICATOR | PURPOSE | READING | INFERENCE |
| 50-Day Moving Average (50MA) | Nature of the current trend by comparing the average price over 50 days | 50 MA = $1.0007Price = $1.2908 (50MA < Price) |
Bullish/Uptrend |
| Relative Strength Index (RSI) | Magnitude of price change;Analyzing oversold & overbought conditions | 54.3319 <30 = Oversold 50-70 = Neutral>70 = Overbought |
Neutral |
| Relative Volume (RVOL) | Asset’s trading volume in relation to its recent average volumes | Below cutoff line | Weak Volume |
SPX6900 (SPX) Price Prediction 2025 — ADX, RVI
In the below chart, we analyze the strength and volatility of SPX6900 (SPX) using the following technical analysis indicators — Average Directional Index (ADX) and Relative Volatility Index (RVI).
SPX/USDT ADX, RVI (Source: TradingView)
From the readings on the chart above, we can make the following inferences regarding the price momentum of SPX6900 (SPX).
| INDICATOR | PURPOSE | READING | INFERENCE |
| Average Directional Index (ADX) | Strength of the trend momentum | 21.4115 | Weak Trend |
| Relative Volatility Index (RVI) | Volatility over a specific period | 40.89 <50 = Low >50 = High |
Low Volatility |
Comparison of SPX with BTC, ETH
Let us now compare the price movements of SPX6900 (SPX) with that of Bitcoin (BTC), and Ethereum (ETH).
BTC Vs ETH Vs SPX Price Comparison (Source: TradingView)
From the above chart, we can interpret that the price action of SPX is similar to that of BTC and ETH. That is, when the price of BTC and ETH increases or decreases, the price of SPX also increases or decreases respectively.
SPX6900 (SPX) Price Prediction 2026, 2027 – 2030
With the help of the aforementioned technical analysis indicators and trend patterns, let us predict the price of SPX6900 (SPX) between 2026, 2027, 2028, 2029, and 2030.
| Year | Bullish Price | Bearish Price |
| SPX6900 (SPX) Price Prediction 2026 | $7 | $0.4 |
| SPX6900 (SPX) Price Prediction 2027 | $9 | $0.3 |
| SPX6900 (SPX) Price Prediction 2028 | $11 | $0.2 |
| SPX6900 (SPX) Price Prediction 2029 | $13 | $0.1 |
| SPX6900 (SPX) Price Prediction 2030 | $15 | $0.09 |
Conclusion
If SPX6900 (SPX) establishes itself as a good investment in 2025, this year would be favorable to the cryptocurrency. In conclusion, the bullish SPX6900 (SPX) price prediction for 2025 is $3.4857. Comparatively, the bearish SPX6900 (SPX) price prediction for 2025 is $0.4945.
If there is a positive elevation in the market momentum and investors’ sentiment, then SPX6900 (SPX) might hit $5. Furthermore, with future upgrades and advancements in the SPX6900 ecosystem, SPX might surpass its current all-time high (ATH) of $1.77 and mark its new ATH.
FAQ
1. What is SPX6900 (SPX)?
SPX6900 (SPX) is a meme-based cryptocurrency that operates primarily on the Ethereum blockchain, with availability on other platforms like Solana and Base.
2. Where can you buy SPX6900 (SPX)?
SPX6900 (SPX) has been listed on many crypto exchanges which include Bybit, Uniswap v2 (Ethereum), Gate.io, Uniswap v3 (Ethereum), Uniswap v3 (Base), Kraken, KuCoin, BitMart, LBank and Deepcoin.
3. Will SPX6900 (SPX) record a new ATH soon?
With the ongoing developments and upgrades within the SPX6900 platform, SPX6900 (SPX) has a high possibility of reaching its ATH soon.
4. What is the current all-time high (ATH) of SPX6900 (SPX)?
SPX6900 (SPX) hit its current all-time high (ATH) of $1.77 on Jan 20, 2025.
5. What is the lowest price of SPX6900 (SPX)?
According to CoinMarketCap, SPX hit its all-time low (ATL) of $0.000002634 on Aug 16, 2023.
6. Will SPX6900 (SPX) hit $5?
If SPX6900 (SPX) becomes one of the active cryptocurrencies that majorly maintain a bullish trend, it might rally to hit $5 soon.
7. What will be the SPX6900 (SPX) price by 2026?
SPX6900 (SPX) price might reach $7 by 2026.
8. What will be the SPX6900 (SPX) price by 2027?
SPX6900 (SPX) price might reach $9 by 2027.
9. What will be the SPX6900 (SPX) price by 2028?
SPX6900 (SPX) price might reach $11 by 2028.
10. What will be the SPX6900 (SPX) price by 2029?
SPX6900 (SPX) price might reach $13 by 2029.
Top Crypto Predictions
DOGS (DOGS) Price Prediction
POPCAT (SOL) Price Prediction
Arbitrum (ARB) Price Prediction
Disclaimer: The opinion expressed in this chart is solely the author’s. It does not represent any investment advice. TheNewsCrypto team encourages all to do their own research before investing.
免責聲明:投資有風險,本文並非投資建議,以上內容不應被視為任何金融產品的購買或出售要約、建議或邀請,作者或其他用戶的任何相關討論、評論或帖子也不應被視為此類內容。本文僅供一般參考,不考慮您的個人投資目標、財務狀況或需求。TTM對信息的準確性和完整性不承擔任何責任或保證,投資者應自行研究並在投資前尋求專業建議。
熱議股票
- 1
- 2
- 3
- 4
- 5
- 6
- 7
- 8
- 9
- 10