Ethereum(ETH) 3D Chart Indicates Potential Bullish Reversal Pattern
- Ethereum's 3D chart shows a bullish reversal pattern with a neckline at $4,000.
- EMA100 serves as dynamic support, and higher lows indicate sustained buying interest and market resilience.
- Based on historical setups, analysts project breakout targets of $6,000 and $7,500.
Ethereum's (ETH) latest technical movements on the 3-day chart indicate promising developments for bullish traders this Q1. Recent chart analysis reveals strong adherence to critical support levels, creating a technical structure often associated with upward price momentum.
Key Support Levels Hold Strong
Market observations display a chart of Ethereum forming an inverse Head and Shoulders pattern with the neckline near $4,000. EMA100 acts as dynamic support, aligning with the right shoulder's formation.
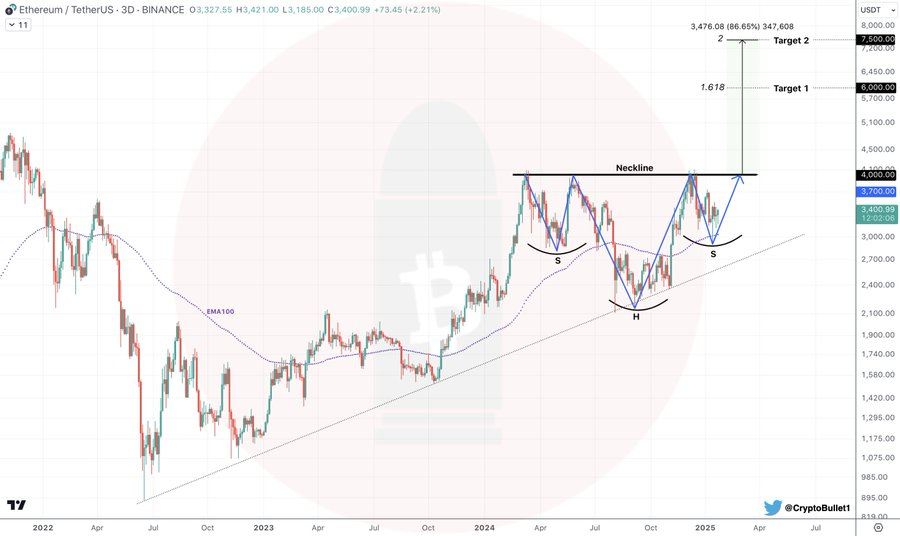
Targets are projected at $6,000 (Target 1) and $7,500 (Target 2), indicating potential upward momentum. Ethereum maintains higher lows, suggesting structural strength approaching the neckline breakout region.
Ethereum’s price action has consistently respected a crucial support line, providing the foundation for the current pattern. The EMA100 has also served as an effective dynamic support level, specifically for the potential formation of the right shoulder in what appears to be a large inverse Head and Shoulders (H&S) pattern.
Higher Low Formation Adds Strength
The formation of a higher low within the chart aligns with the expected prerequisites of the inverse H&S pattern. This pattern typically signals a trend reversal, providing a bullish outlook for Ethereum's price in the near term. The higher low indicates sustained buying interest at progressively higher levels, reinforcing the market’s resilience.
Sentiment surrounding Ethereum remains subdued, which often correlates with an increased probability of sharp price movements. Low sentiment periods frequently coincide with critical price pivots as market participants reassess positions.
Based on the inverse H&S structure, Ethereum’s projected breakout levels point toward significant price targets. Analysts outline $6,000 as the initial target, with a secondary objective of $7,500. These targets align with historical price behavior observed in similar technical setups.
免責聲明:投資有風險,本文並非投資建議,以上內容不應被視為任何金融產品的購買或出售要約、建議或邀請,作者或其他用戶的任何相關討論、評論或帖子也不應被視為此類內容。本文僅供一般參考,不考慮您的個人投資目標、財務狀況或需求。TTM對信息的準確性和完整性不承擔任何責任或保證,投資者應自行研究並在投資前尋求專業建議。
熱議股票
- 1
- 2
- 3
- 4
- 5
- 6
- 7
- 8
- 9
- 10