Why These Altcoins Are Trending Today — January 24
- Reploy (RAI) dropped 4% to $5.66 despite a 10% surge in trading volume, hinting at bearish market activity.
- Mantra (OM) saw a 1% price gain to $3.62, though bearish pressure persists with its Elder-Ray Index at -0.12.
- THORChain (RUNE)dropped 19% to $2.41, trading below its Super Trend indicator and signaling bearish momentum.
The cryptocurrency market has surged today, fueled by a 44% rise in trading volume over the last 24 hours. This comes after Thursday’s decline in market activity, reflected by the 2% drop in total market capitalization.
As the market recovers, Reploy (RAI), Mantra (OM), and THORChain (RUNE) are some of the altcoins trending today.
Reploy (RAI)
AI-based token RAI is one of the trending altcoins today. It currently trades at $5.66, noting a 4% price decline over the past 24 hours. This price dip is accompanied by a 10% spike in daily trading volume, confirming the surge in selloffs.
When an asset’s price drops while its trading volume rises, it indicates heightened market activity. More traders are selling off assets, possibly driven by fear or negative sentiment. This divergence suggests increased market volatility and the potential for further downward pressure.
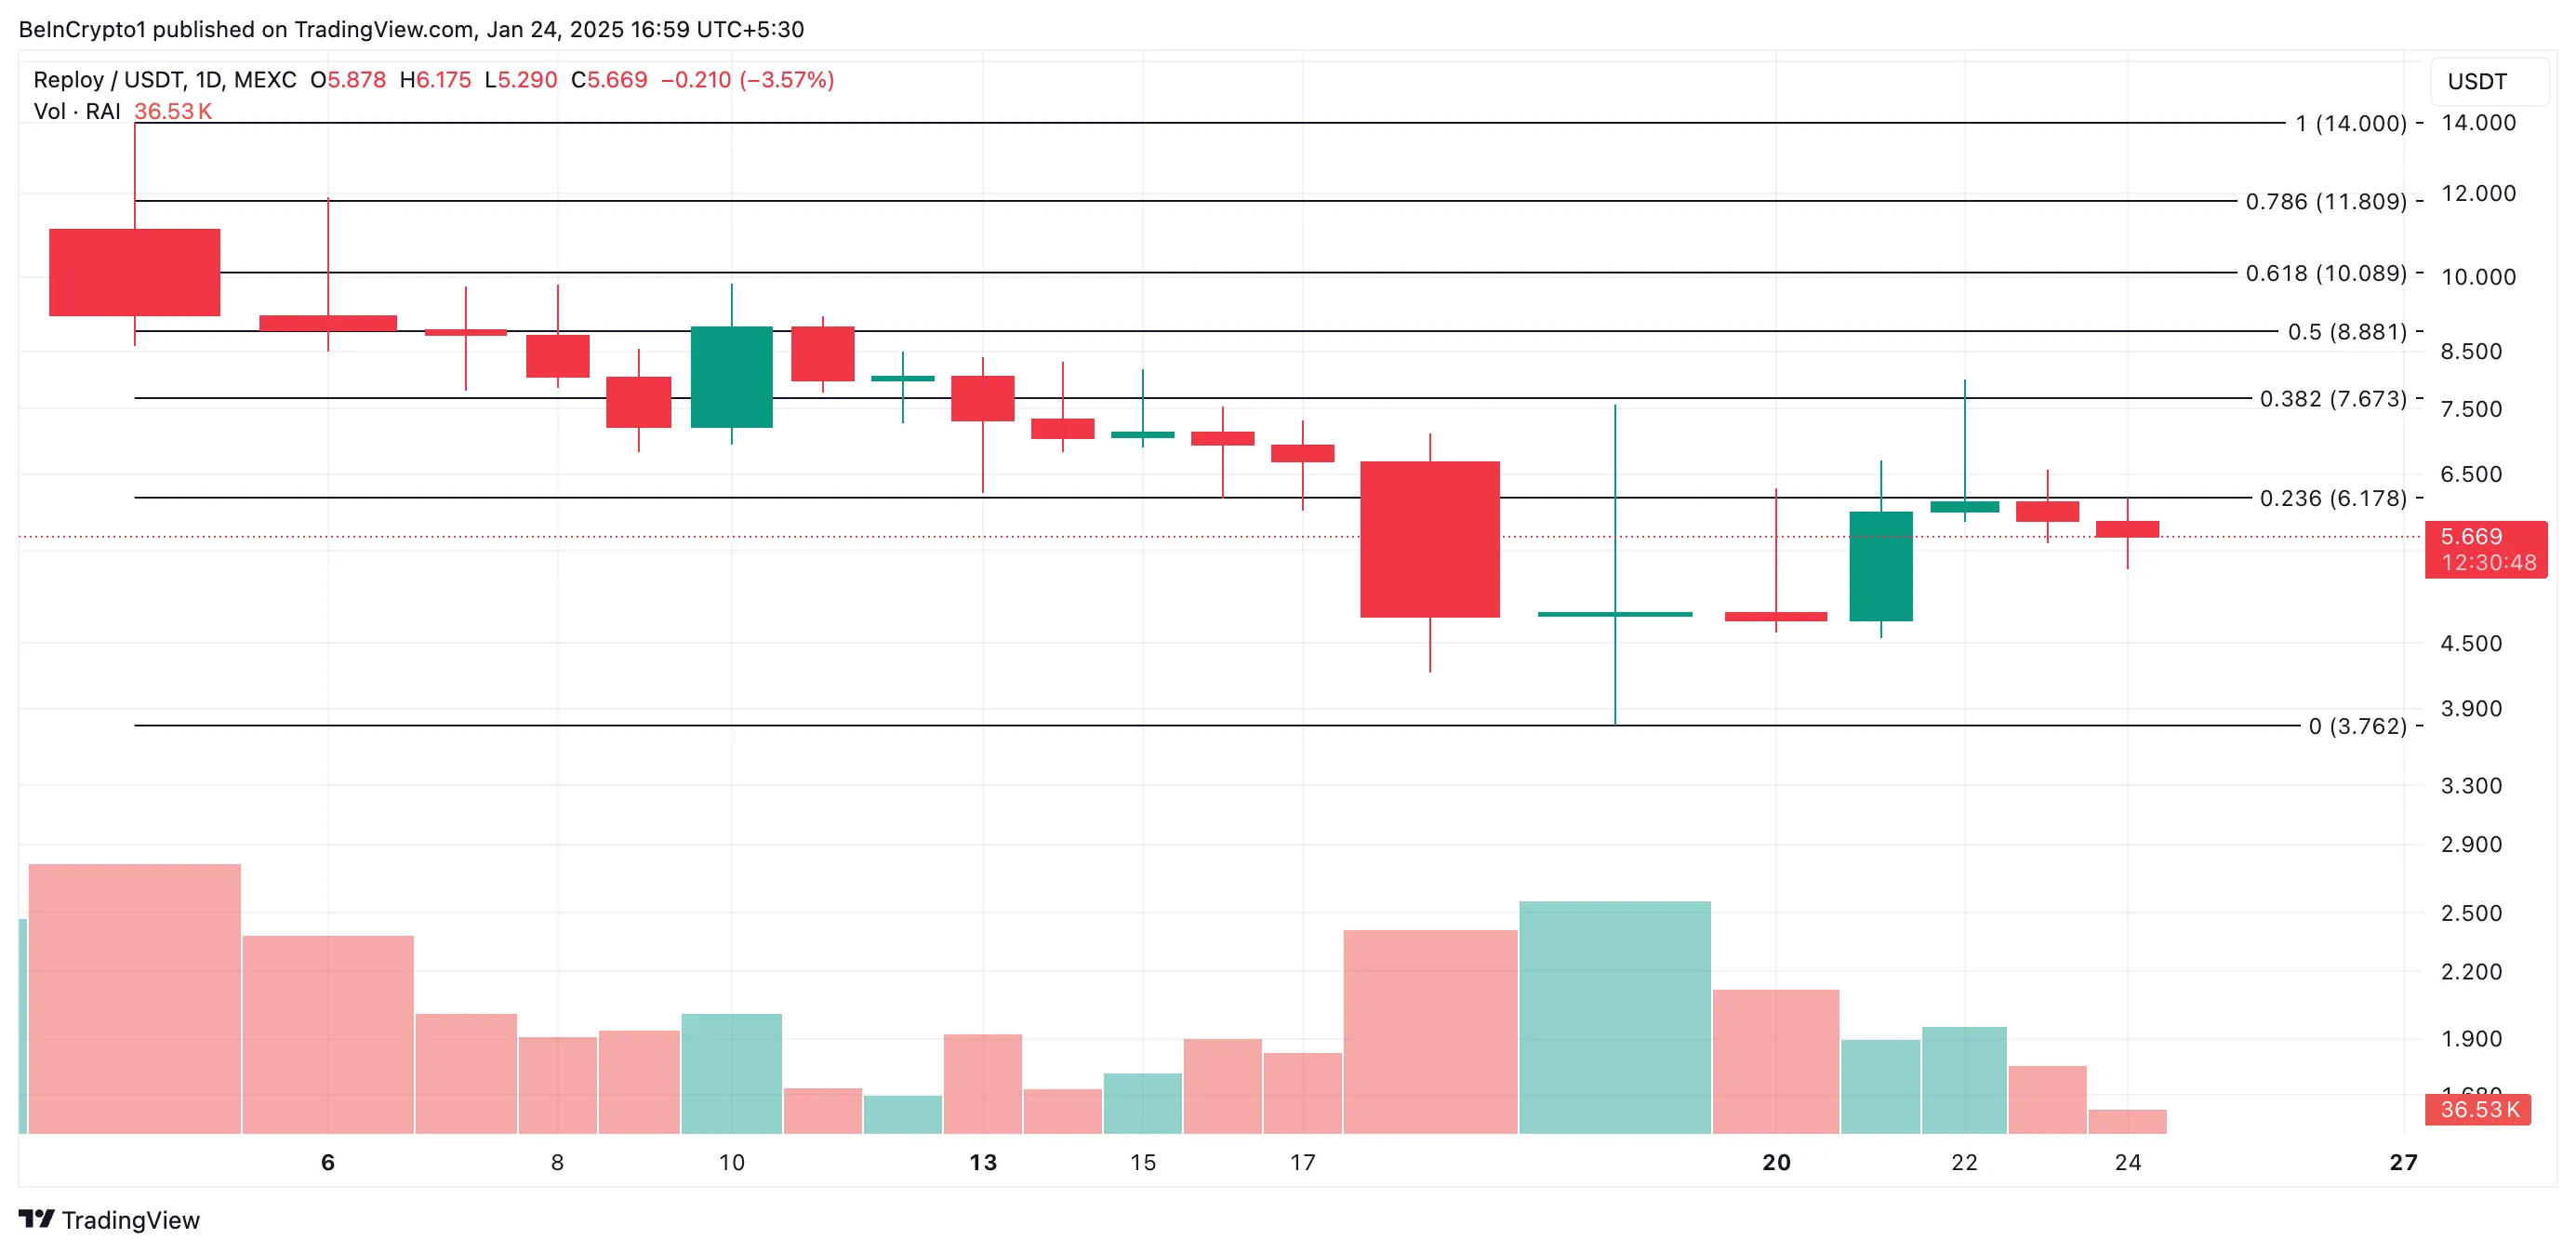
RAI’s price could drop toward $3.76 as downward pressure strengthens. Conversely, a resurgence in RAI demand could drive the token’s value up to $7.67.
Mantra (OM)
OM, the native coin of the real-world asset (RWA) Layer-1 (L1) blockchain Mantra is another asset trending today. It trades at $3.62, witnessing a 1% price hike in the past 24 hours.
However, this slight uptick merely mirrors broader market gains, as selling activity remains underway in the OM spot markets. Readings from its Elder-Ray Index, which is at -0.12 at press time, confirm this.
This indicator measures the strength of an asset’s bulls and bears by comparing the high and low prices to an exponential moving average (EMA). When the index is negative like this, it indicates that bears are dominating the market, suggesting downward pressure and a bearish trend.
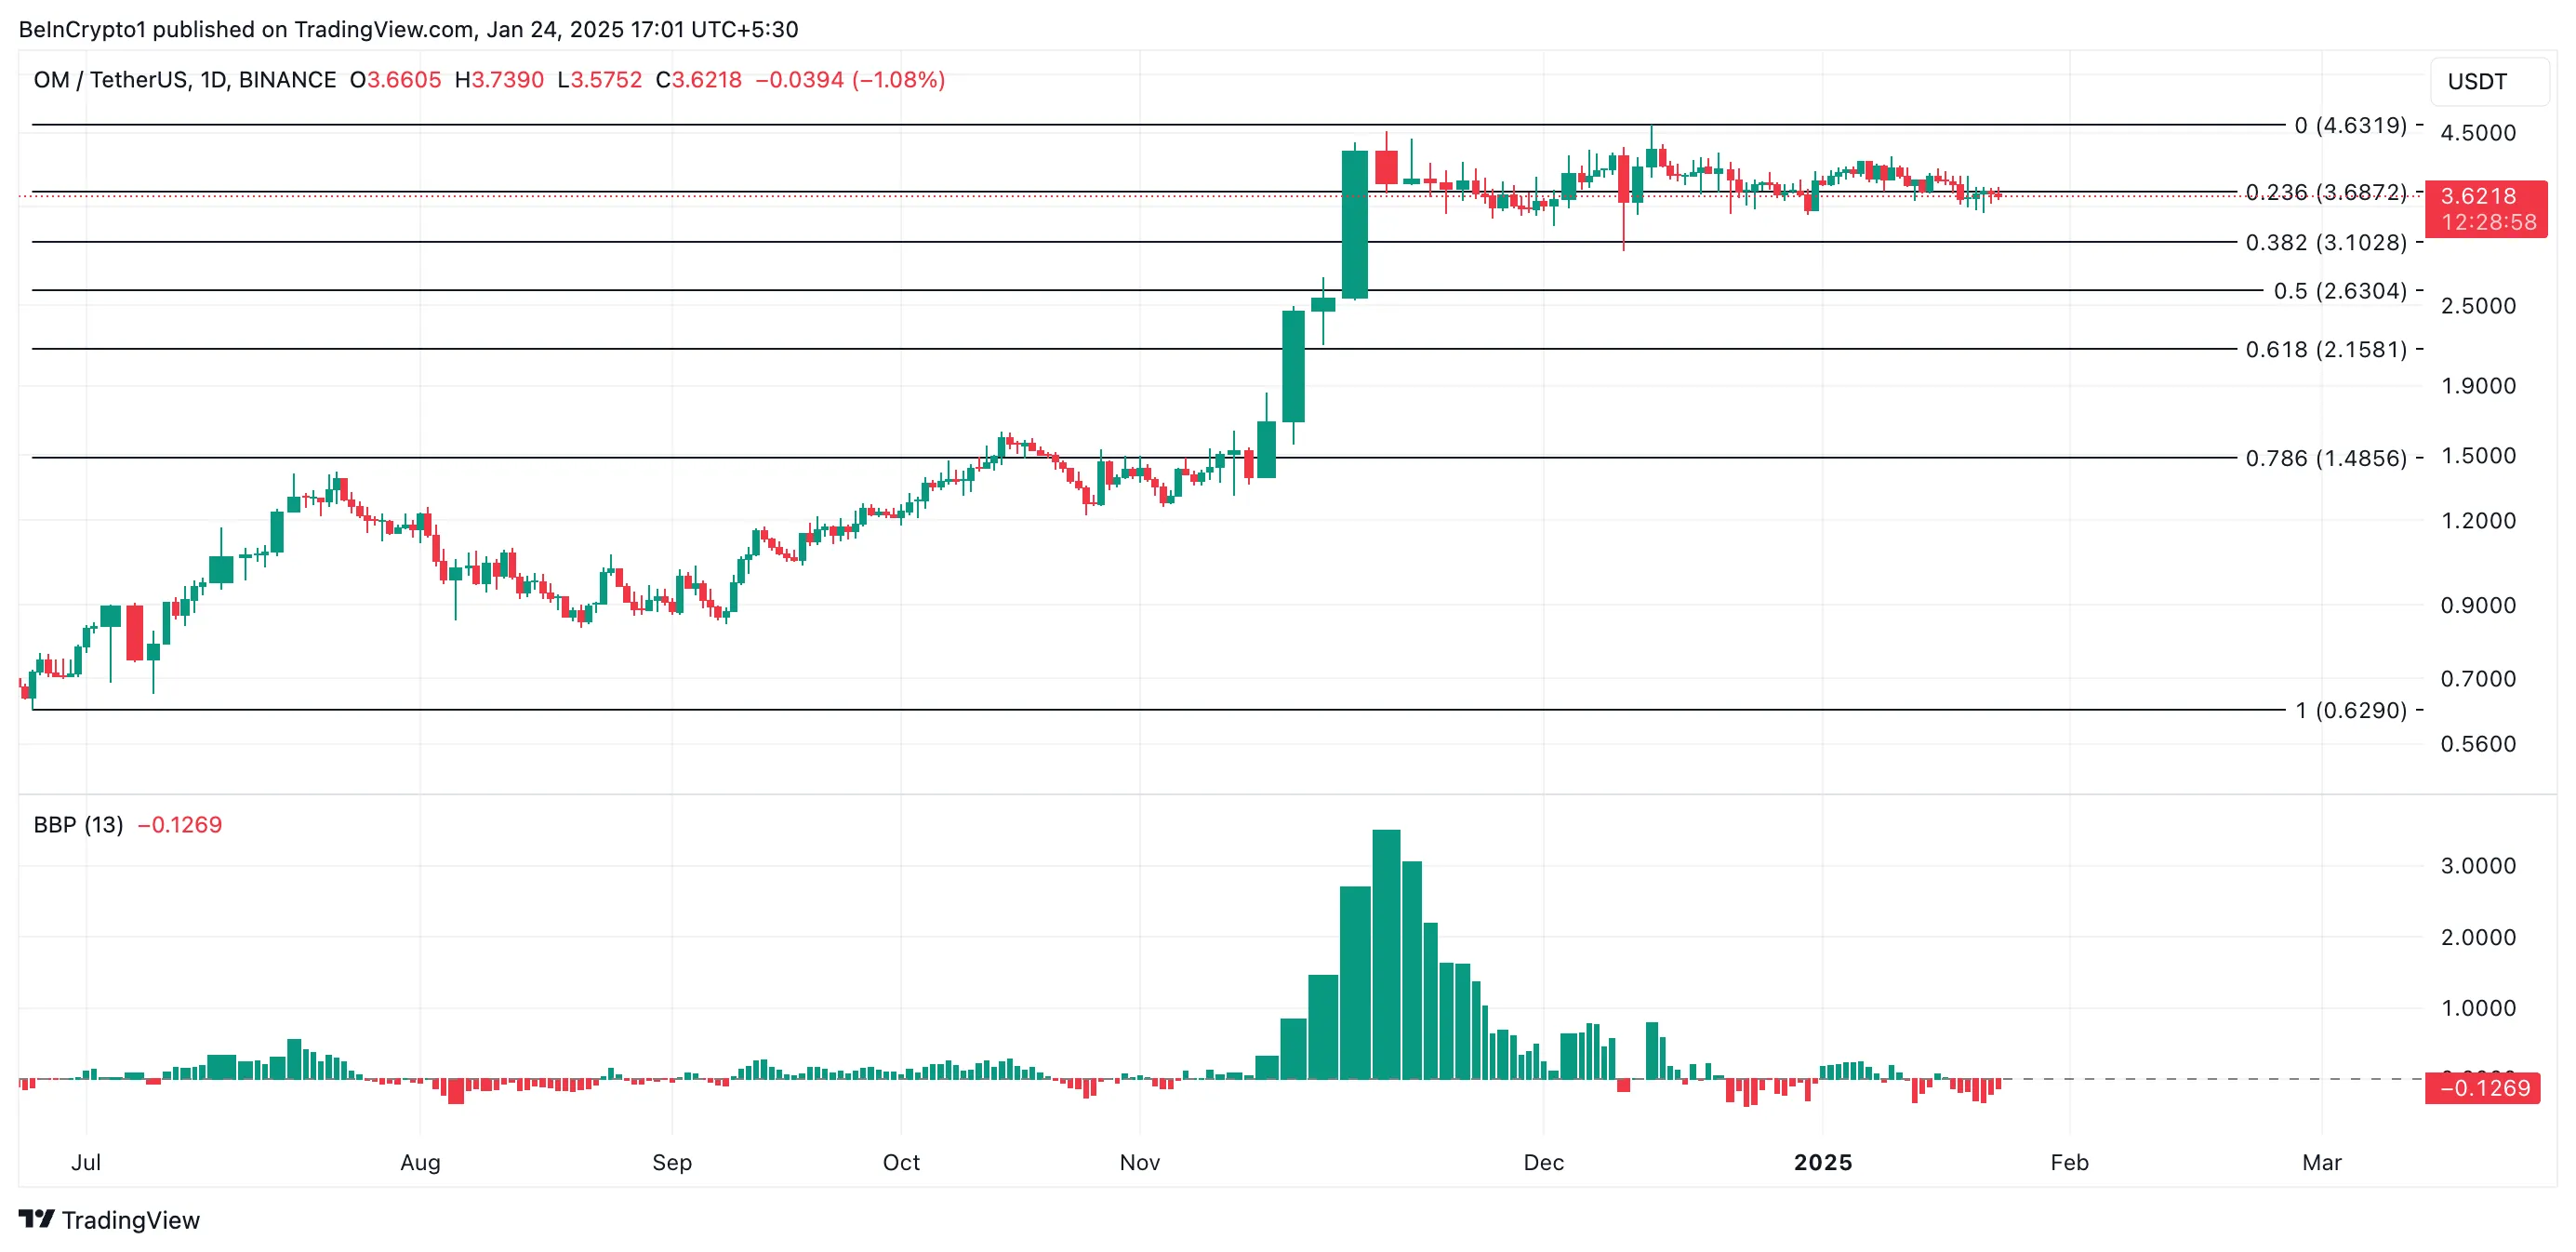
If this trend persists, OM’s price could fall to $3.10. However, if the bulls regain market control, they could drive the coin’s price toward its all-time high of $4.63.
THORChain (RUNE)
THORChain’s RUNE is currently trading at its lowest price since October. Over the past 24 hours, its value has dropped by 19%. At $2.40, RUNE is sitting below the red line of its Super Trend indicator, signaling strong bearish pressure in the market.
This indicator is a trend-following technical analysis tool that helps traders identify the market’s direction by placing a line above or below the price chart based on the asset’s volatility. When an asset’s price trades below the Super Trend line, it typically signals a bearish trend, indicating that the market is in a downtrend or that selling pressure is dominant.
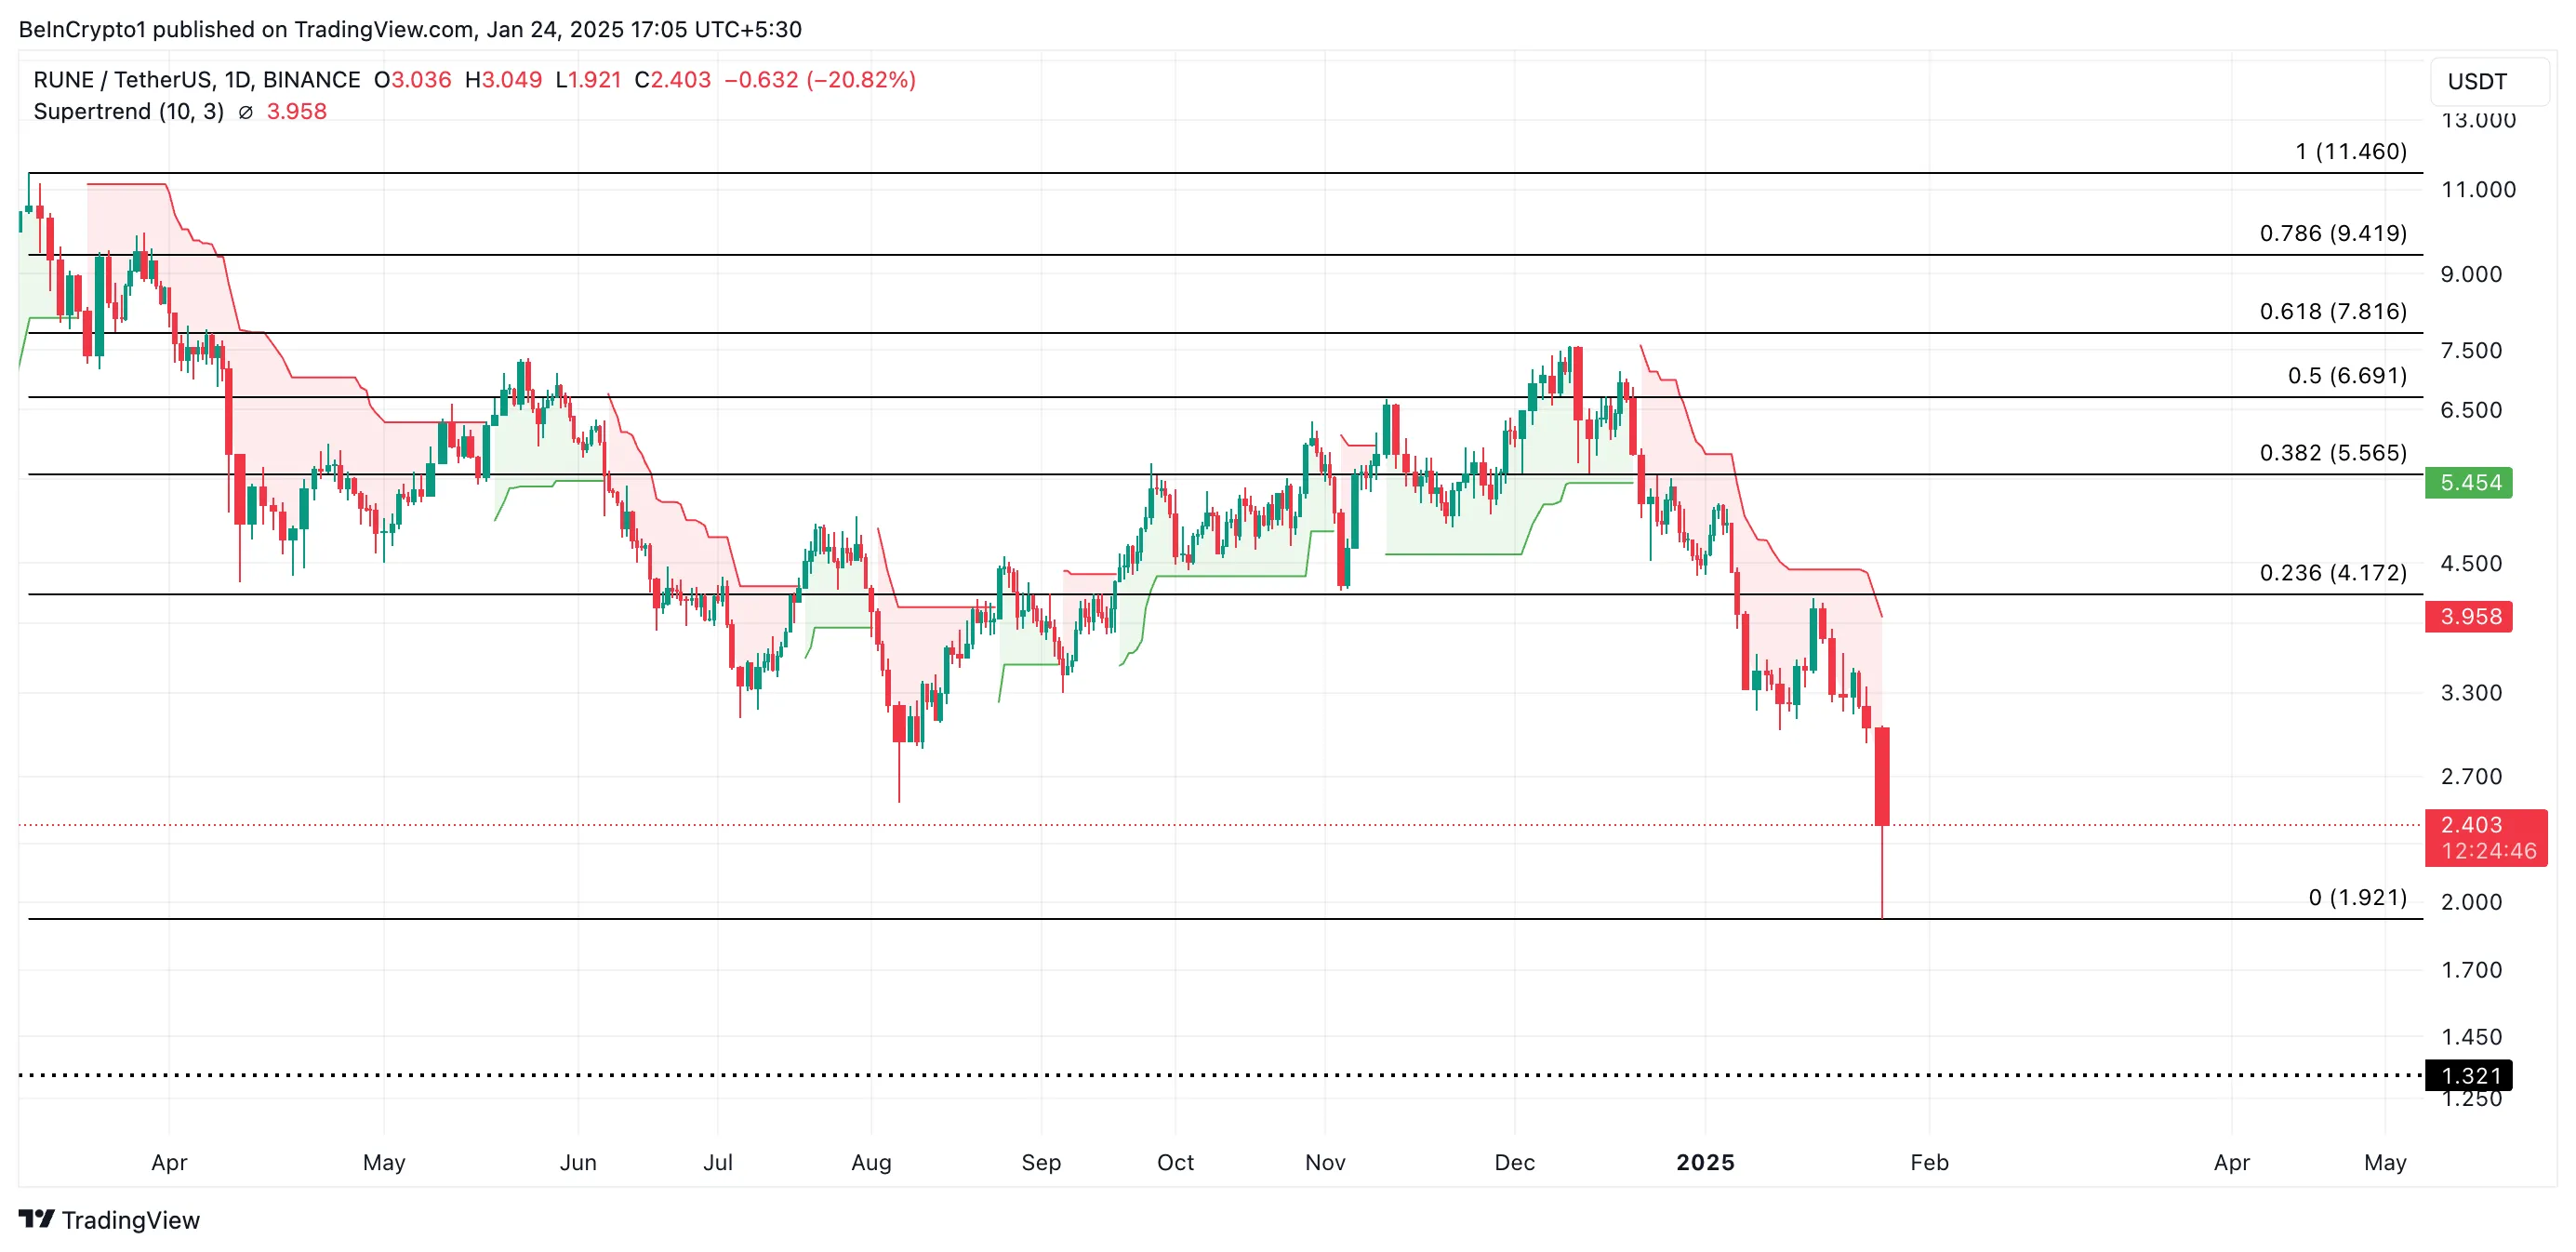
If the downtrend continues, RUNE’s price could fall to $1.92. On the flip side, a resurgence in RUNE accumulation could drive its price to $4.17.
免責聲明:投資有風險,本文並非投資建議,以上內容不應被視為任何金融產品的購買或出售要約、建議或邀請,作者或其他用戶的任何相關討論、評論或帖子也不應被視為此類內容。本文僅供一般參考,不考慮您的個人投資目標、財務狀況或需求。TTM對信息的準確性和完整性不承擔任何責任或保證,投資者應自行研究並在投資前尋求專業建議。
熱議股票
- 1
- 2
- 3
- 4
- 5
- 6
- 7
- 8
- 9
- 10