Teva Pharmaceutical Industries Full Year 2024 Earnings: EPS Misses Expectations
Teva Pharmaceutical Industries (NYSE:TEVA) Full Year 2024 Results
Key Financial Results
- Revenue: US$16.5b (up 4.4% from FY 2023).
- Net loss: US$1.64b (loss widened by 193% from FY 2023).
- US$1.45 loss per share (further deteriorated from US$0.50 loss in FY 2023).
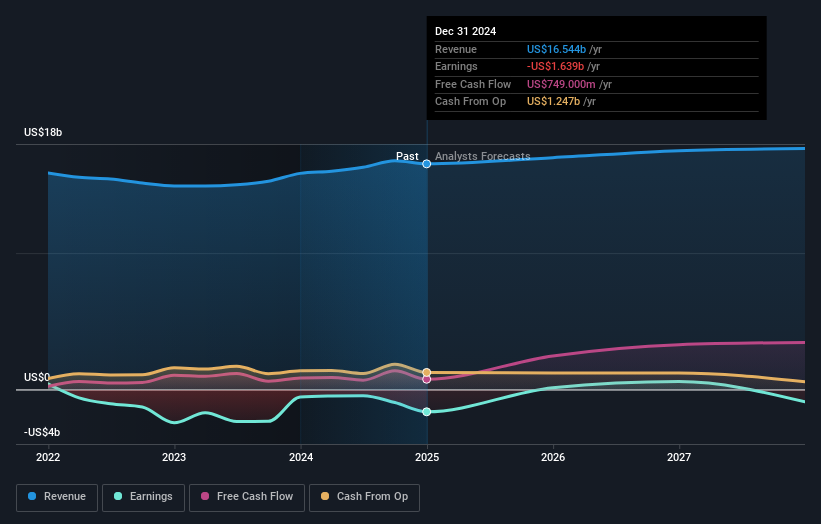
All figures shown in the chart above are for the trailing 12 month (TTM) period
Teva Pharmaceutical Industries EPS Misses Expectations
Revenue was in line with analyst estimates. Earnings per share (EPS) missed analyst estimates significantly.
Looking ahead, revenue is forecast to grow 3.5% p.a. on average during the next 3 years, compared to a 9.1% growth forecast for the Pharmaceuticals industry in the US.
Performance of the American Pharmaceuticals industry.
The company's shares are down 16% from a week ago.
Balance Sheet Analysis
While it's very important to consider the profit and loss statement, you can also learn a lot about a company by looking at its balance sheet. We've done some analysis and you can see our take on Teva Pharmaceutical Industries' balance sheet.
Valuation is complex, but we're here to simplify it.
Discover if Teva Pharmaceutical Industries might be undervalued or overvalued with our detailed analysis, featuring fair value estimates, potential risks, dividends, insider trades, and its financial condition.
Access Free AnalysisHave feedback on this article? Concerned about the content? Get in touch with us directly. Alternatively, email editorial-team (at) simplywallst.com.This article by Simply Wall St is general in nature. We provide commentary based on historical data and analyst forecasts only using an unbiased methodology and our articles are not intended to be financial advice. It does not constitute a recommendation to buy or sell any stock, and does not take account of your objectives, or your financial situation. We aim to bring you long-term focused analysis driven by fundamental data. Note that our analysis may not factor in the latest price-sensitive company announcements or qualitative material. Simply Wall St has no position in any stocks mentioned.
免責聲明:投資有風險,本文並非投資建議,以上內容不應被視為任何金融產品的購買或出售要約、建議或邀請,作者或其他用戶的任何相關討論、評論或帖子也不應被視為此類內容。本文僅供一般參考,不考慮您的個人投資目標、財務狀況或需求。TTM對信息的準確性和完整性不承擔任何責任或保證,投資者應自行研究並在投資前尋求專業建議。
熱議股票
- 1
- 2
- 3
- 4
- 5
- 6
- 7
- 8
- 9
- 10