Has Delorean Corporation Limited's (ASX:DEL) Impressive Stock Performance Got Anything to Do With Its Fundamentals?
Most readers would already be aware that Delorean's (ASX:DEL) stock increased significantly by 12% over the past week. Given that stock prices are usually aligned with a company's financial performance in the long-term, we decided to study its financial indicators more closely to see if they had a hand to play in the recent price move. Particularly, we will be paying attention to Delorean's ROE today.
Return on equity or ROE is an important factor to be considered by a shareholder because it tells them how effectively their capital is being reinvested. In short, ROE shows the profit each dollar generates with respect to its shareholder investments.
View our latest analysis for Delorean
How Do You Calculate Return On Equity?
The formula for ROE is:
Return on Equity = Net Profit (from continuing operations) ÷ Shareholders' Equity
So, based on the above formula, the ROE for Delorean is:
54% = AU$4.8m ÷ AU$8.8m (Based on the trailing twelve months to June 2024).
The 'return' is the income the business earned over the last year. So, this means that for every A$1 of its shareholder's investments, the company generates a profit of A$0.54.
What Is The Relationship Between ROE And Earnings Growth?
We have already established that ROE serves as an efficient profit-generating gauge for a company's future earnings. We now need to evaluate how much profit the company reinvests or "retains" for future growth which then gives us an idea about the growth potential of the company. Generally speaking, other things being equal, firms with a high return on equity and profit retention, have a higher growth rate than firms that don’t share these attributes.
A Side By Side comparison of Delorean's Earnings Growth And 54% ROE
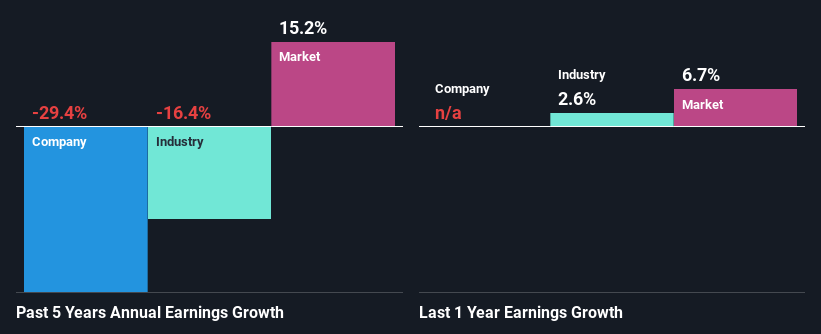
Firstly, we acknowledge that Delorean has a significantly high ROE. Secondly, even when compared to the industry average of 8.9% the company's ROE is quite impressive. Needless to say, we are quite surprised to see that Delorean's net income shrunk at a rate of 29% over the past five years. So, there might be some other aspects that could explain this. Such as, the company pays out a huge portion of its earnings as dividends, or is faced with competitive pressures.
As a next step, we compared Delorean's performance with the industry and found thatDelorean's performance is depressing even when compared with the industry, which has shrunk its earnings at a rate of 16% in the same period, which is a slower than the company.
The basis for attaching value to a company is, to a great extent, tied to its earnings growth. What investors need to determine next is if the expected earnings growth, or the lack of it, is already built into the share price. Doing so will help them establish if the stock's future looks promising or ominous. If you're wondering about Delorean's's valuation, check out this gauge of its price-to-earnings ratio, as compared to its industry.
Is Delorean Using Its Retained Earnings Effectively?
Because Delorean doesn't pay any regular dividends, we infer that it is retaining all of its profits, which is rather perplexing when you consider the fact that there is no earnings growth to show for it. So there could be some other explanations in that regard. For instance, the company's business may be deteriorating.
Conclusion
In total, it does look like Delorean has some positive aspects to its business. Although, we are disappointed to see a lack of growth in earnings even in spite of a high ROE and and a high reinvestment rate. We believe that there might be some outside factors that could be having a negative impact on the business. While we won't completely dismiss the company, what we would do, is try to ascertain how risky the business is to make a more informed decision around the company. To know the 2 risks we have identified for Delorean visit our risks dashboard for free.
New: Manage All Your Stock Portfolios in One Place
We've created the ultimate portfolio companion for stock investors, and it's free.
• Connect an unlimited number of Portfolios and see your total in one currency• Be alerted to new Warning Signs or Risks via email or mobile• Track the Fair Value of your stocks
Try a Demo Portfolio for FreeHave feedback on this article? Concerned about the content? Get in touch with us directly. Alternatively, email editorial-team (at) simplywallst.com.This article by Simply Wall St is general in nature. We provide commentary based on historical data and analyst forecasts only using an unbiased methodology and our articles are not intended to be financial advice. It does not constitute a recommendation to buy or sell any stock, and does not take account of your objectives, or your financial situation. We aim to bring you long-term focused analysis driven by fundamental data. Note that our analysis may not factor in the latest price-sensitive company announcements or qualitative material. Simply Wall St has no position in any stocks mentioned.
免責聲明:投資有風險,本文並非投資建議,以上內容不應被視為任何金融產品的購買或出售要約、建議或邀請,作者或其他用戶的任何相關討論、評論或帖子也不應被視為此類內容。本文僅供一般參考,不考慮您的個人投資目標、財務狀況或需求。TTM對信息的準確性和完整性不承擔任何責任或保證,投資者應自行研究並在投資前尋求專業建議。
熱議股票
- 1
- 2
- 3
- 4
- 5
- 6
- 7
- 8
- 9
- 10