TechnipFMC plc's (NYSE:FTI) P/S Still Appears To Be Reasonable
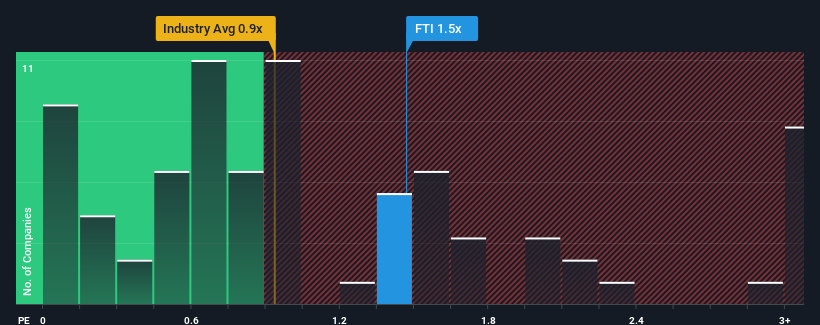
When close to half the companies in the Energy Services industry in the United States have price-to-sales ratios (or "P/S") below 0.9x, you may consider TechnipFMC plc (NYSE:FTI) as a stock to potentially avoid with its 1.5x P/S ratio. However, the P/S might be high for a reason and it requires further investigation to determine if it's justified.
View our latest analysis for TechnipFMC
How TechnipFMC Has Been Performing
With revenue growth that's superior to most other companies of late, TechnipFMC has been doing relatively well. The P/S is probably high because investors think this strong revenue performance will continue. You'd really hope so, otherwise you're paying a pretty hefty price for no particular reason.
Want the full picture on analyst estimates for the company? Then our free report on TechnipFMC will help you uncover what's on the horizon.What Are Revenue Growth Metrics Telling Us About The High P/S?
TechnipFMC's P/S ratio would be typical for a company that's expected to deliver solid growth, and importantly, perform better than the industry.
If we review the last year of revenue growth, the company posted a terrific increase of 18%. The strong recent performance means it was also able to grow revenue by 36% in total over the last three years. Accordingly, shareholders would have definitely welcomed those medium-term rates of revenue growth.
Turning to the outlook, the next three years should generate growth of 8.5% each year as estimated by the analysts watching the company. That's shaping up to be materially higher than the 4.9% per year growth forecast for the broader industry.
With this information, we can see why TechnipFMC is trading at such a high P/S compared to the industry. Apparently shareholders aren't keen to offload something that is potentially eyeing a more prosperous future.
The Final Word
It's argued the price-to-sales ratio is an inferior measure of value within certain industries, but it can be a powerful business sentiment indicator.
Our look into TechnipFMC shows that its P/S ratio remains high on the merit of its strong future revenues. Right now shareholders are comfortable with the P/S as they are quite confident future revenues aren't under threat. Unless these conditions change, they will continue to provide strong support to the share price.
A lot of potential risks can sit within a company's balance sheet. Our free balance sheet analysis for TechnipFMC with six simple checks will allow you to discover any risks that could be an issue.
It's important to make sure you look for a great company, not just the first idea you come across. So if growing profitability aligns with your idea of a great company, take a peek at this free list of interesting companies with strong recent earnings growth (and a low P/E).
Valuation is complex, but we're here to simplify it.
Discover if TechnipFMC might be undervalued or overvalued with our detailed analysis, featuring fair value estimates, potential risks, dividends, insider trades, and its financial condition.
Access Free AnalysisHave feedback on this article? Concerned about the content? Get in touch with us directly. Alternatively, email editorial-team (at) simplywallst.com.This article by Simply Wall St is general in nature. We provide commentary based on historical data and analyst forecasts only using an unbiased methodology and our articles are not intended to be financial advice. It does not constitute a recommendation to buy or sell any stock, and does not take account of your objectives, or your financial situation. We aim to bring you long-term focused analysis driven by fundamental data. Note that our analysis may not factor in the latest price-sensitive company announcements or qualitative material. Simply Wall St has no position in any stocks mentioned.
免責聲明:投資有風險,本文並非投資建議,以上內容不應被視為任何金融產品的購買或出售要約、建議或邀請,作者或其他用戶的任何相關討論、評論或帖子也不應被視為此類內容。本文僅供一般參考,不考慮您的個人投資目標、財務狀況或需求。TTM對信息的準確性和完整性不承擔任何責任或保證,投資者應自行研究並在投資前尋求專業建議。
熱議股票
- 1
- 2
- 3
- 4
- 5
- 6
- 7
- 8
- 9
- 10